Like most websites, we use own and third party cookies for analytical purposes and to show you personalised advertising or based on your browsing habits.
Generally, the information does not directly identify you, but can provide you with a more personalised web experience. Because we respect your right to privacy, you may choose not to allow us to use certain cookies. However, blocking some types of cookies may affect your experience on the site and the services we can offer.
For more information, you can read our cookie policy.
TikTok Study September 2023
Uncovering the Answers to TikTok’s Biggest Questions
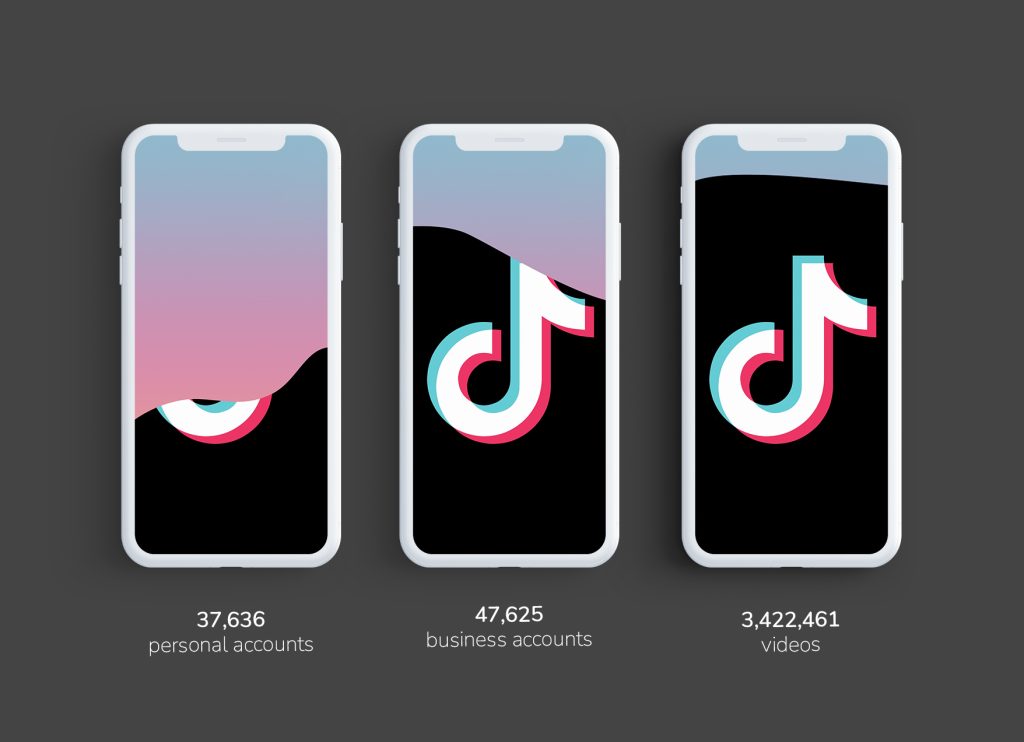
After analyzing 3,422,461 videos from 85,261 accounts [personal and business] over a 180-day period.
TikTok raises heated debates such as: How many videos should you upload per day? How long should a TikTok video be? What is the best time to post a video? What matters more, views or likes? What content is more viral on TikTok? How can you gain more followers? And so on…
🥶It is said, it is speculated, it is assumed.
But if there is one thing we are sure of here at Metricool, it’s that the answers rest in the data, and thus the purpose of this TikTok study.
To analyze what is happening on TikTok, with data in hand, so that creators, brands, and social media professionals can make better decisions.
The Study Sample
The sample of this TikTok study is larger than the previous study. This allows us to see data and conclusions with more accuracy.
Here are the changes in the sample:
| March 2023 | Update 2023 | Increase | |
| Videos | 1,907,846 | 3,422,461 | 79.39% |
| Accounts | 48,591 | 85,261 | 75.47% |
| Personal Accounts | 30,655 | 37,636 | 22.77% |
| Business Accounts* | 17,936 | 47,625 | 165.53% |
| Personal Videos | 1,419,099 | 1,754,879 | 23.66% |
| Business Videos | 488,747 | 1,667,582 | 241.20% |
The current study analyzes 47,625 business accounts and 37,636 personal accounts (from creators and personal brands) of different sizes, to make it easier to compare and analyze whether your TikTok strategy is on trend.
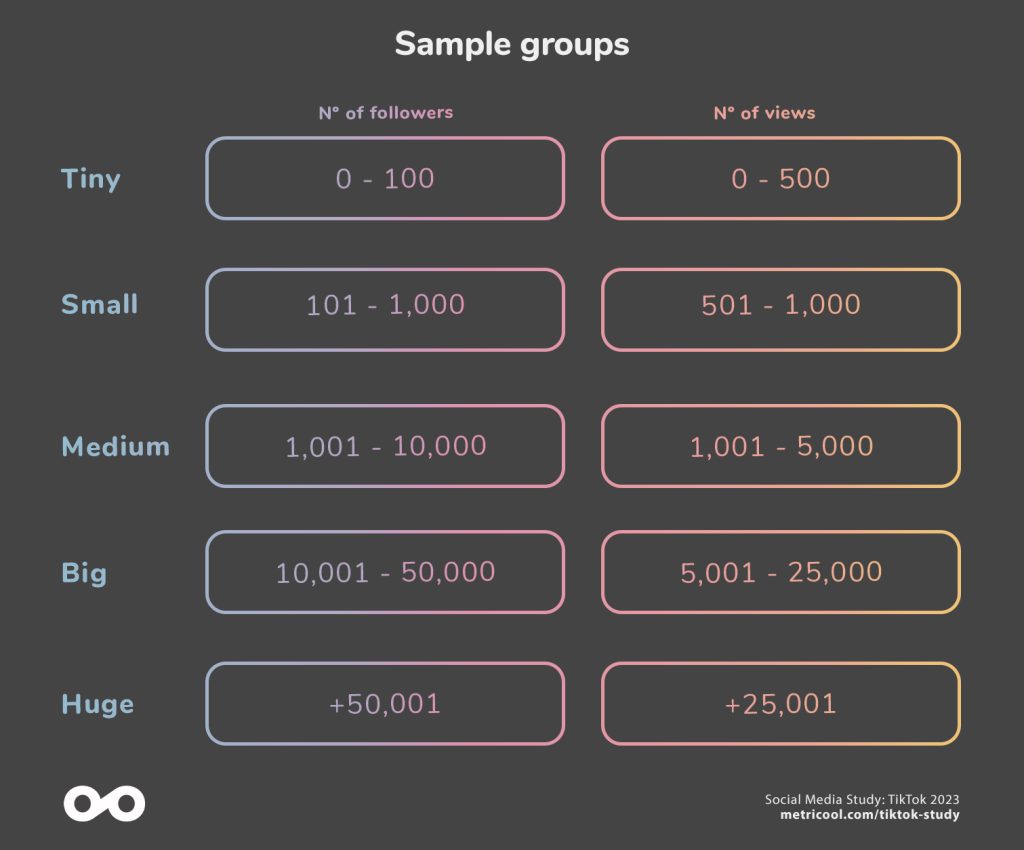
To facilitate comparison in size trends and views, we grouped the total number of accounts, 85,261, and videos, 3,422,461, based on:
✔ SIZE by account followers at the time the video was posted,
✔ VOLUME based on views achieved per video.
The results being:
TikTok Trends 2023
These are the biggest changes in the study compared to the 2022-2023 study.
This highlights the increase of business accounts by 165.53% and therefore the increase in videos from these accounts by 241.20%
This data indicates that TikTok continues to grow as a professional channel for brands to carry out their strategies. While in the past brands were wary to join TikTok, it seems that in 2023 many of them have taken that leap.
As the market matures, brands are eager for more data and to start exploring other areas, such as advertising on TikTok, which is only accessible with a business account.
Posting frequency and length of videos increases. Videos longer than 54 seconds receive the most views
The length of videos with significant views increases by 12.2 seconds, in relation to the 41.8 seconds from the previous study.
Visits from TikTok’s search engine double
Meanwhile, the number of views from the following section has decreased. This could indicate a shift in the behavioral uses of TikTok.
The engagement rate drops as a whole
Across all account sizes we observed a general decrease in engagement.
How to use the TikTok study
This analysis combines the analyzed accounts, regardless of sector, to find general trends on the network. In addition to this data, it is always advisable to analyze your own strategy and measure the evolution of your TikTok account and content.
To Have a Personal Account or Business Account on TikTok?
Here is the data from the study, comparing personal and business accounts. When we say “personal” accounts, we are still referring to professional use, thus including both content creators and personal brands.
Let’s see if there are any differences based on the analysis.
Posting frequency
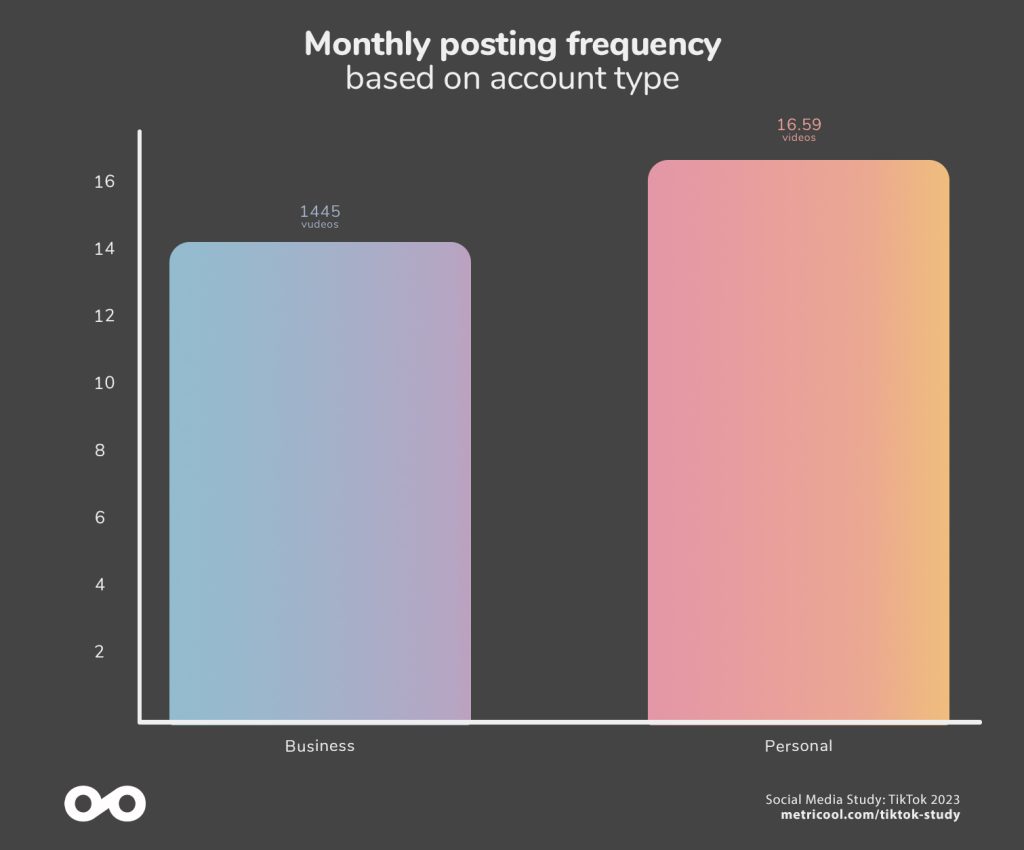
On average, personal accounts post more videos per month than company accounts. On average, personal accounts post 16.59 videos per month compared to 14.45 videos for business accounts.
Both account types exceed the average of a 3x per week posting frequency, thus these numbers are extremely close. However, it’s personal accounts that reach the 4 videos per week number. Which would mean they are posting 1 extra video per week.
| 2022 | 2023 | Difference | |
| Business | 13.4 | 14.45 | +7.84% |
| Personal | 16.1 | 16.59 | +3.04% |
* In regards to the 2022-2023 TikTok Study, we can see that both accounts have increased their posting frequency, with the largest being that of business accounts at 7.84%, compared to 3.04% for personal accounts.
Consistency
Looking at consistency, we also observed that personal accounts (mostly professional content creators) posted three or more videos per week for a longer period of time compared to business accounts.
Views
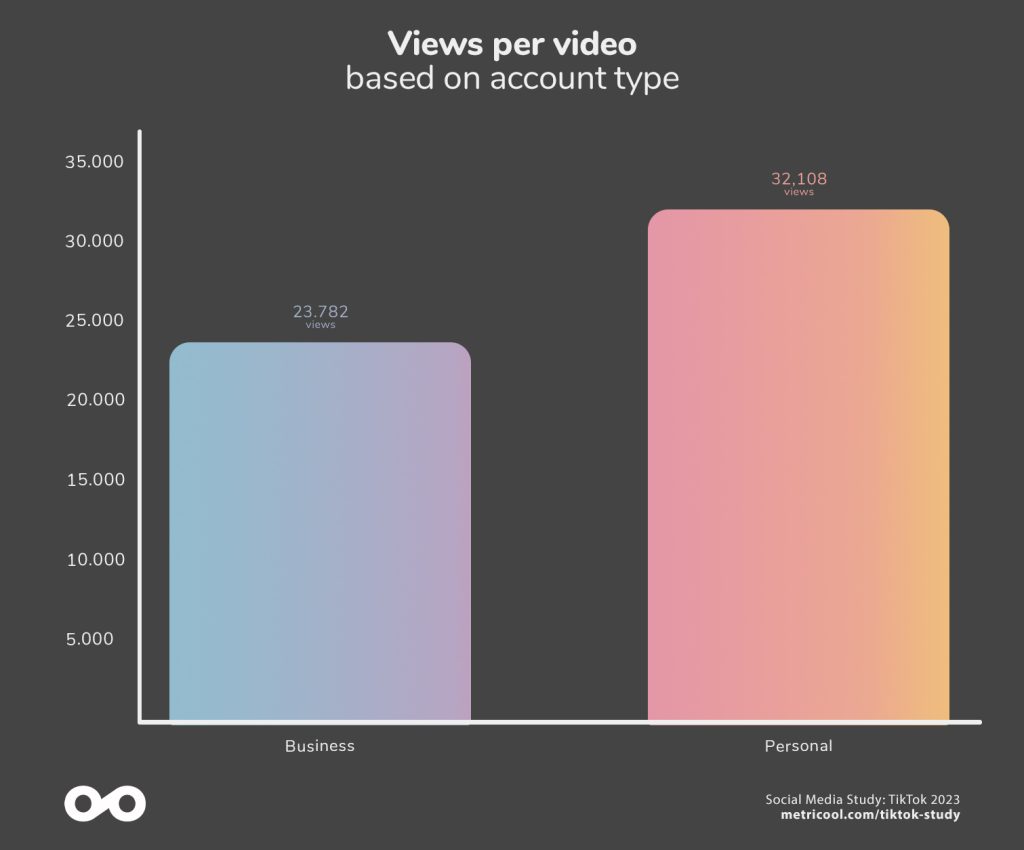
Regarding views per video, we also saw the balance tip. The average number of views per video for personal accounts is 32,107 compared to an average of 23,781 for business accounts.
The average number of views for business accounts has increased by 35.72% with respect to the previous study.
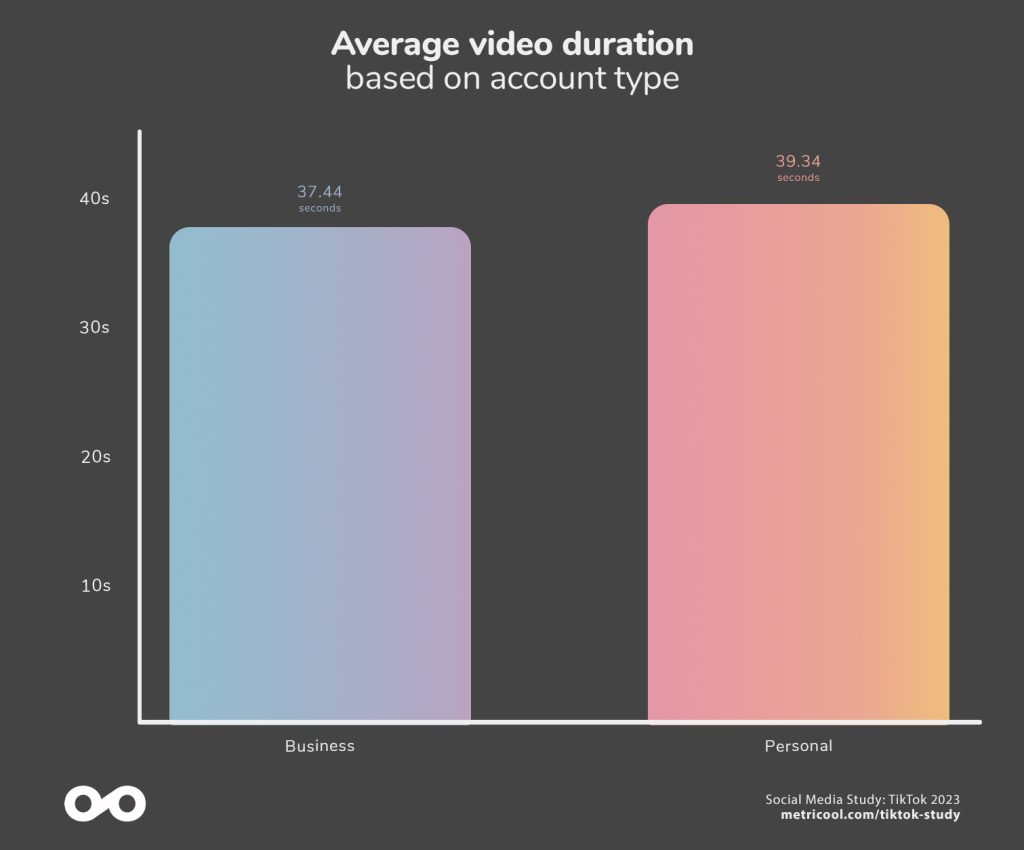
The average length of a video is also longer for personal accounts, with:
Business accounts: 37.7 seconds
Personal accounts: 39.3 seconds
| 2022 | 2023 | Difference | |
| Business | 17,523 | 23,782 | +35.72% |
| Personal | 30,115 | 32,108 | +6.62% |
| 2022 | 2023 | Difference | |
| Business | 34 | 37.44 | +10.12% |
| Personal | 34 | 39.34 | +15.71% |
Engagement
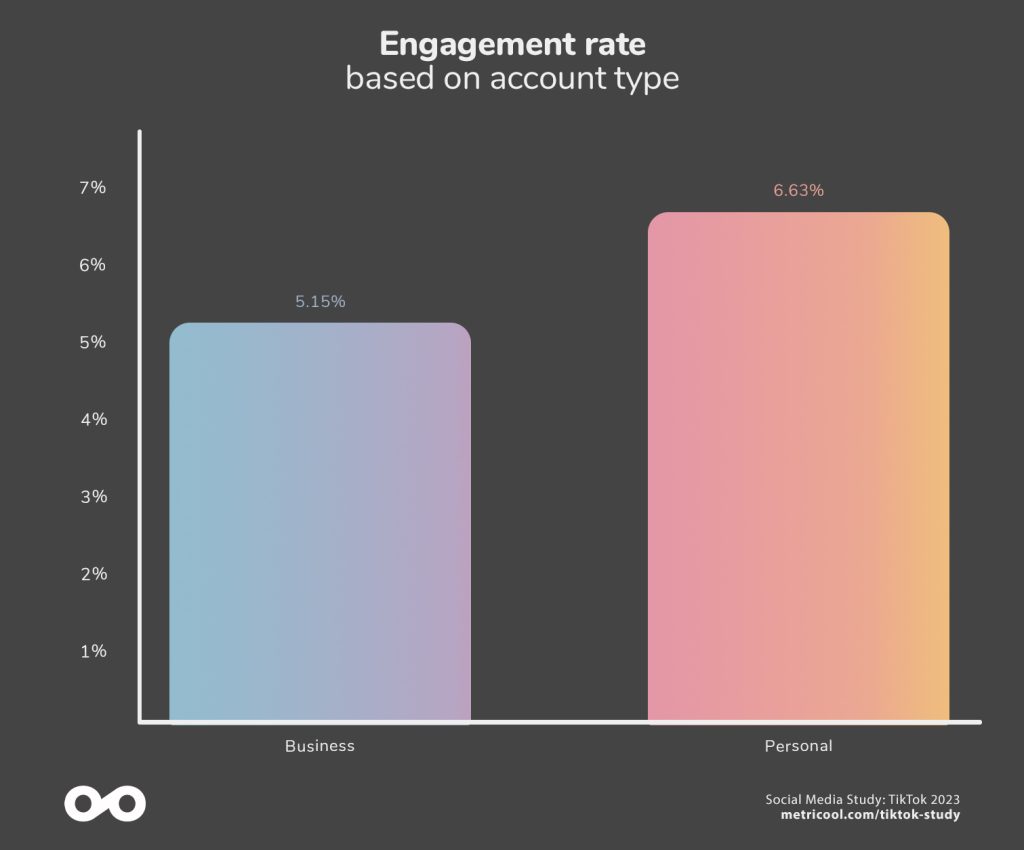
As for the engagement rate, (calculated by the sum of interactions/visits x 100) we can see that personal accounts receive, on average, 1.5% more engagement per video compared to business accounts. Specifically, 5.15% vs. 6.63%.
Overall, there is a drop in engagement compared to the previous study, regardless of the account type.
| 2022 | 2023 | Diferencia | |
| Business | 6.10% | 5.15% | -15.57% |
| Personal | 7% | 6.63% | -5.29% |
Consider this…
What’s Better on TikTok: Personal or Business Account?
Looking just at the data, it may seem that it’s better to have a personal account than a business account. However, the reality is that the differences could be attributed to other factors, for example, if the personal account is an influencer or content creator that may have more affinity with their audience, therefore generating more interactions.
No evidence points to the fact that it is “better” to have a personal account over a business account.
How the Size of a TikTok Account Influences Views and Interactions
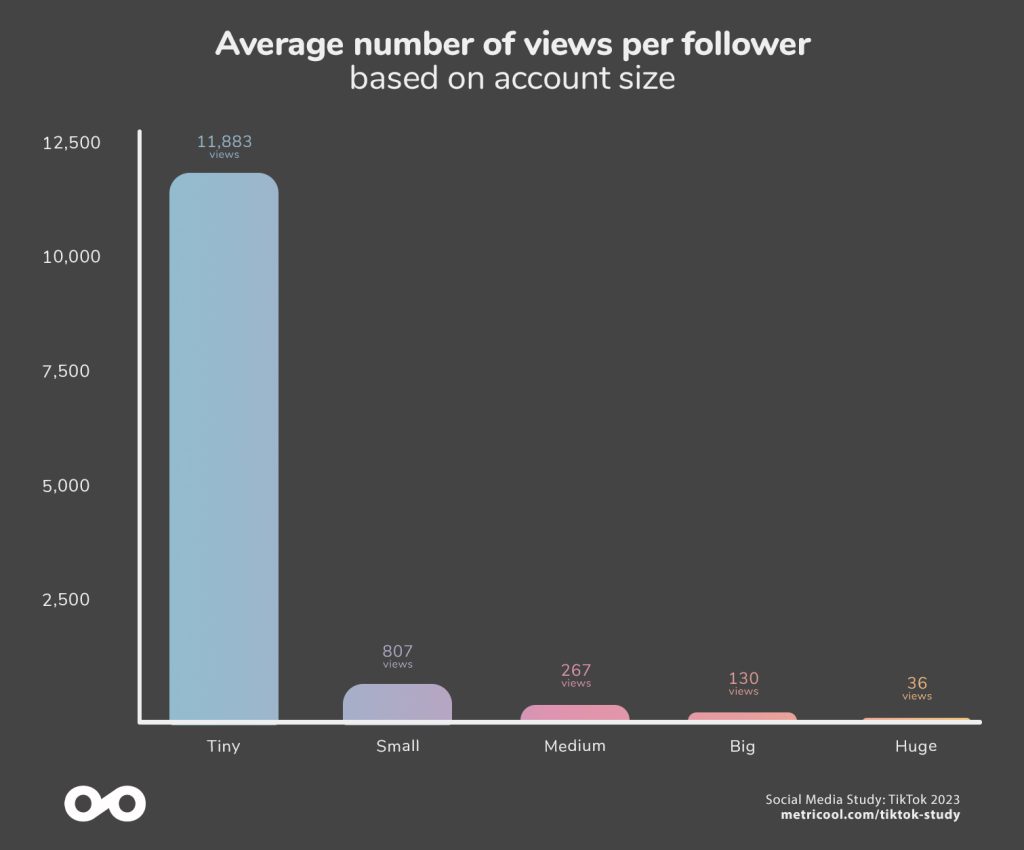
Generally speaking, we can see that the number of views per the number of followers has increased for all account sizes. This may be due to the fact that on average, users have spent more time on TikTok.
Does follower size matter on TikTok?
It’s true that this metric is the most attractive when clicking on a profile. But, if there’s one thing we know, it’s that TikTok has changed the rules of the game.
Consuming content doesn’t depend on whether a user follows an account, but on their behavior, and which content they interact with. The data speaks for itself.
Do I need followers for my videos to gain views?
Definitely not.
If we look at the video views to the number of followers ratio, we can clearly see that videos are exposed to a larger audience. The important thing is not the account that publishes it, but the quality of the content. This means that all videos have the same opportunity to gain views.
| 2022 | 2023 | Difference | |
| Tiny | 8,506 | 11,883 | +39.71% |
| Small | 561 | 807 | +43.91% |
| Medium | 229 | 267 | +16.61% |
| Big | 121 | 130 | +7.70% |
| Huge | 34 | 36 | +6.15% |
Who has the best engagement rate?
| 2022 | 2023 | Difference | |
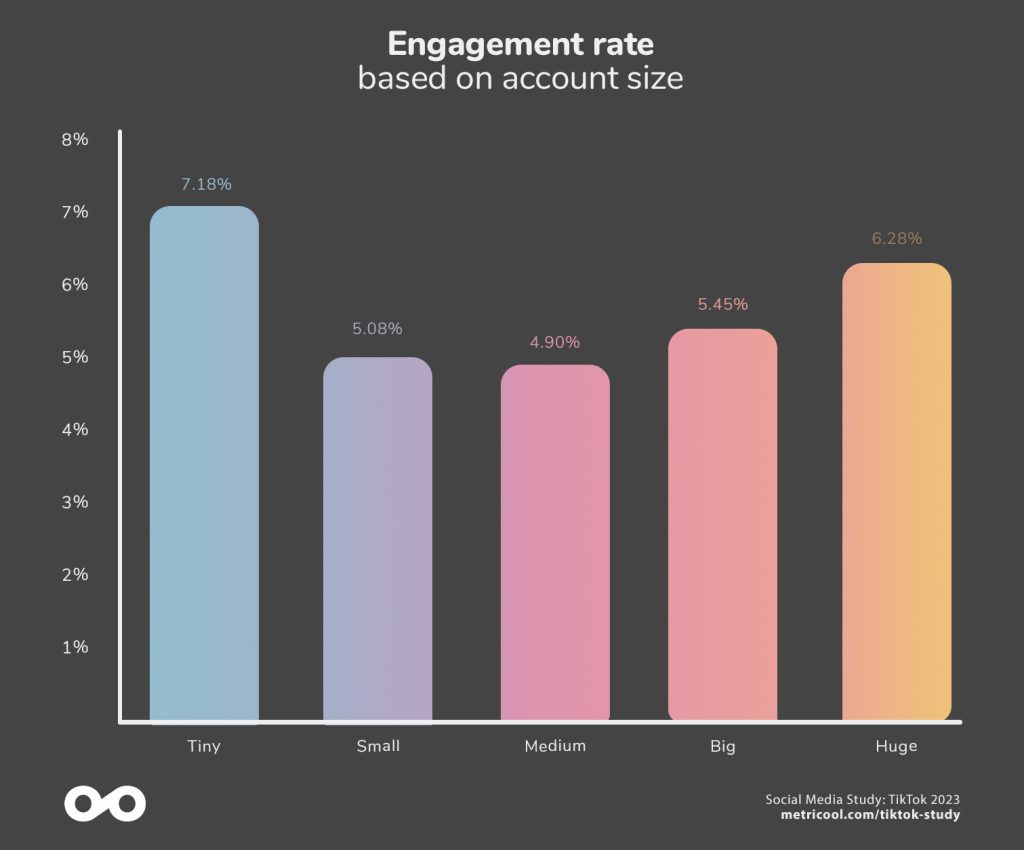
| Tiny | 7.10% | 7.18% | +1.16% |
| Small | 4.70% | 5.08% | +8.12% |
| Medium | 5.10% | 4.90% | -4.02% |
| Big | 5.70% | 5.45% | -4.44% |
| Huge | 7.50% | 6.28% | -16.23% |
As we can see in the graph, Tiny [7.18%] and Huge [6.28%] accounts are those with the highest engagement rates compared to the rest.
Accounts with less than 100 followers (Tiny) will have high engagement percentages due to a lower number views based on the intimacy of their audience.
However, it’s worth noting the data for the large accounts. Normally, the higher the number of views, the more complicated it is to maintain a high engagement rate. But what we see in TikTok is just the opposite.
As the number of views increases, interactions also increase, which shows that the algorithm is capable of continuing to find new audiences that interact with related content.
Consider this…
Which TikTok accounts have the best engagement?
Unlike other social networks, on TikTok, engagement increases as the size of an account increases. The exception is for small accounts, where the norm of a great number of followers in the total number of views is met.
What is the Length of Viral Videos on TikTok? Which Videos Get the Most Views and Engagement?
Yet another great unknown on TikTok, knowing how or when a video will go viral. As much as we wish we could give you the magic formula in this study, here’s what our data found.
What is the length of videos by account size?There’s a certain trend we can see in terms of video length. Accounts with a larger following (Huge) tend to post longer videos, with an average of 47.4s, compared to smaller accounts (Tiny), with an average of 33.1s.
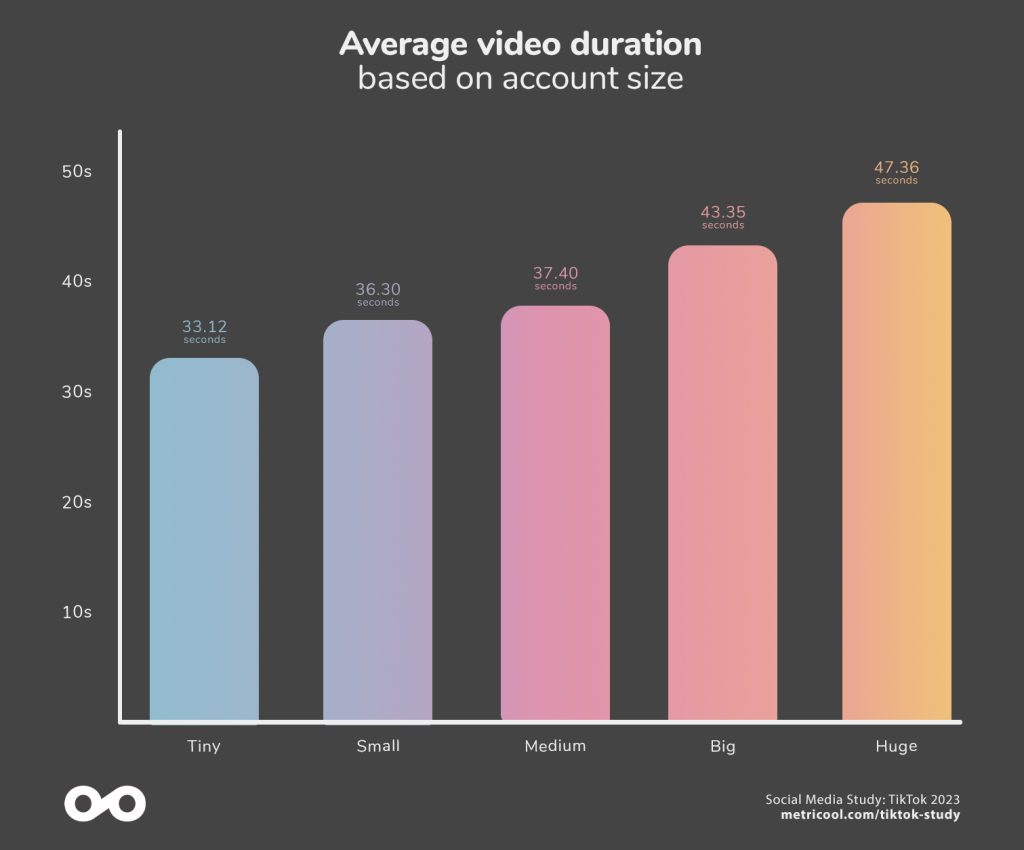
| 2022 | 2023 | Difference | |
| Tiny | 31.20 | 33.12 | +6.16% |
| Small | 33.90 | 36.30 | +7.08% |
| Medium | 33.90 | 37.40 | +10.32% |
| Big | 36.20 | 43.35 | +19.76% |
| Huge | 40.60 | 47.36 | +16.64% |
What is the length of videos that get the most views?
We found that the videos with the most views have an average duration of 54s.
Compared to the previous study, we see that the average video length for videos with the highest number of views has increased by 12.2s, compared to the previous average duration of 41.8s.
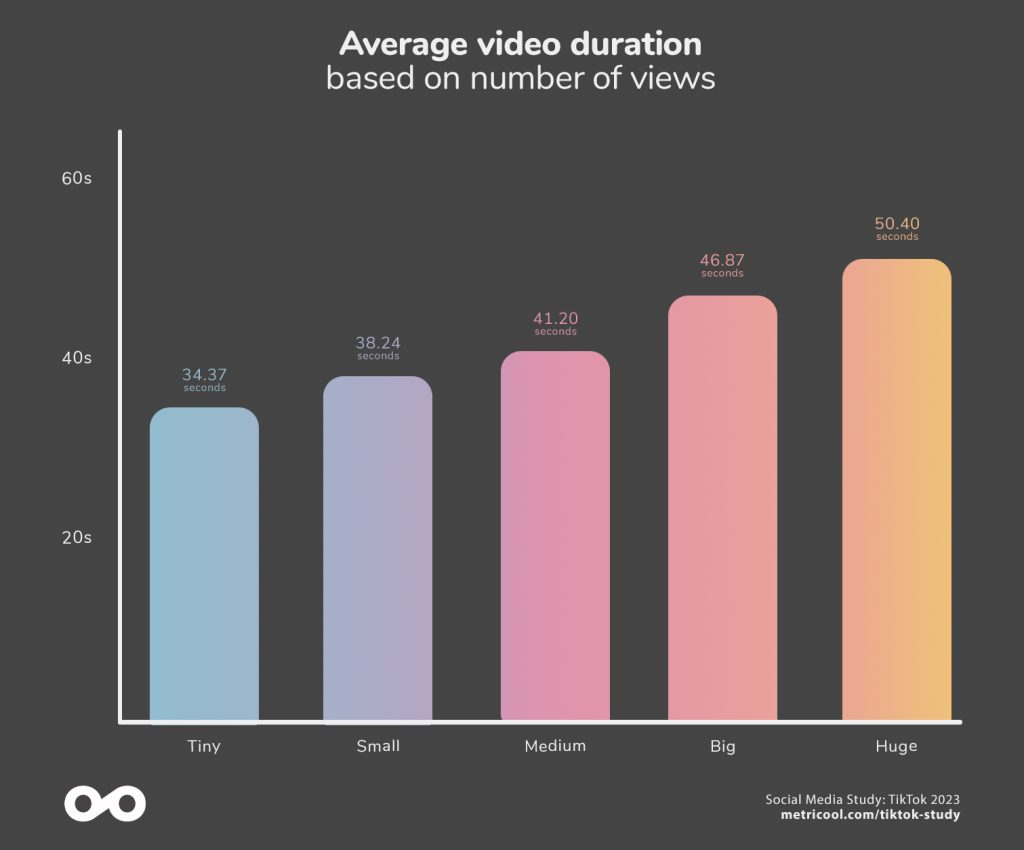
| 2022 | 2023 | Difference | |
| Tiny | 32.40 | 34.37 | +6.09% |
| Small | 36.40 | 38.24 | +5.04% |
| Medium | 35.40 | 41.20 | +16.37% |
| Big | 38.50 | 46.87 | +21.74% |
| Huge | 41.90 | 50.40 | +20.29% |
Similarly, if we look at the average video views based on the length, we see that longer videos receive more views.
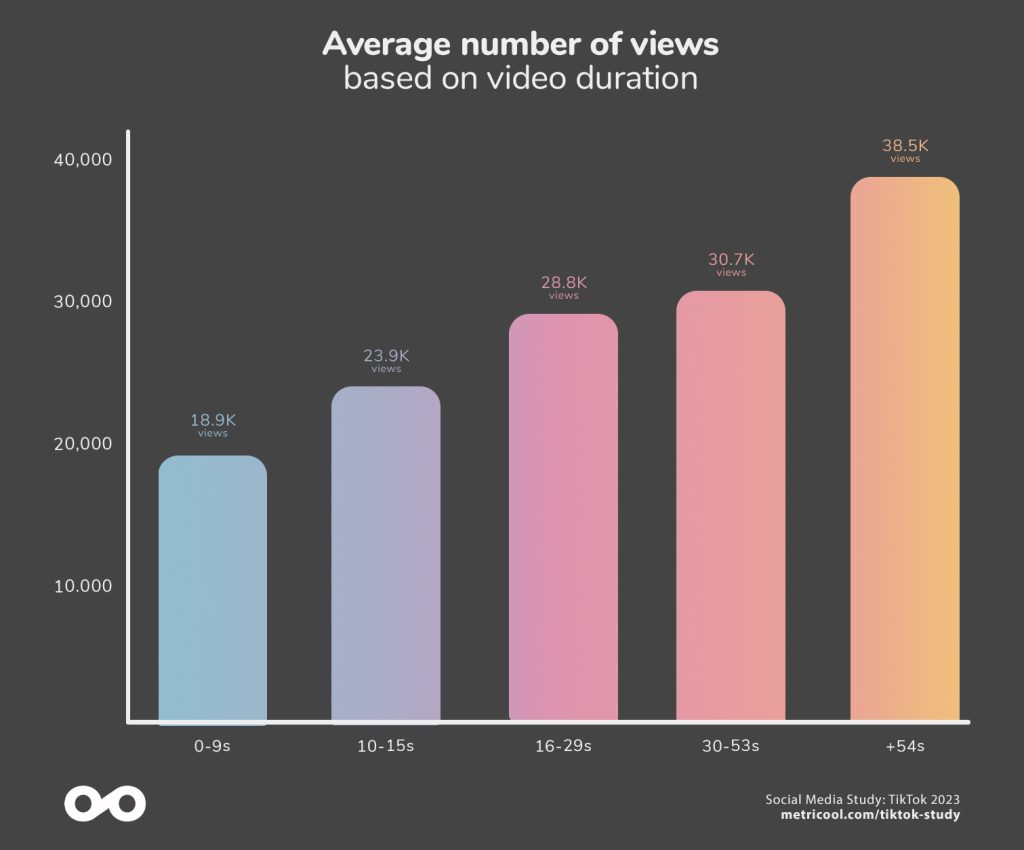
| 2022 | 2023 | Difference | |
| Tiny | 21,000 | 18,994 | -9.55% |
| Small | 22,200 | 23,930 | +7.80% |
| Medium | 29,400 | 28,863 | -1.83% |
| Big | 30,400 | 30,733 | +1.10% |
| Huge | 32,100 | 38,526 | +20.02% |
Longer videos receive more interactions and have a higher engagement rate. That is to say, the longer the length of the video, the more chances for a viewer to leave an interaction, and the more likely the video has an increase in reach. (CAREFUL: As long as the retention is high).
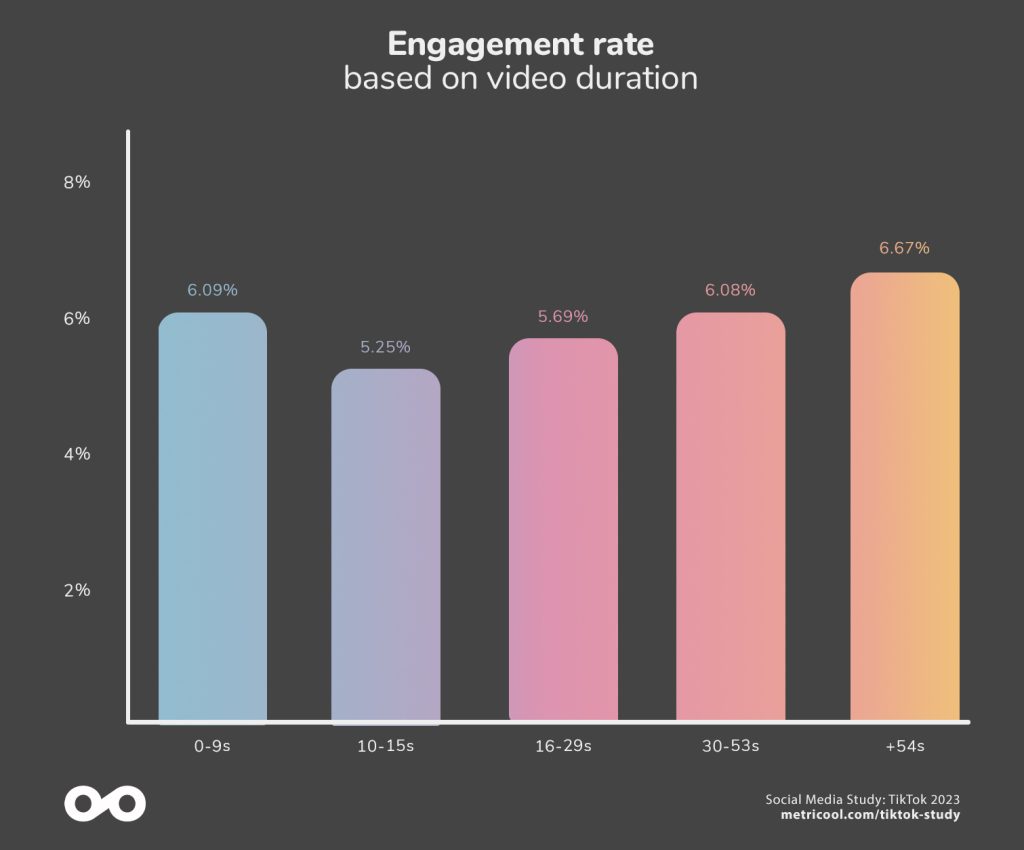
| 2022 | 2023 | Difference | |
| 0-9s | 6.30% | 6.09% | -3.38% |
| 10-15s | 6.10% | 5.25% | -14.01% |
| 16-29s | 6.50% | 5.69% | -12.43% |
| 30-53s | 7% | 6.08% | -13.15% |
| +54s | 8.20% | 6.67% | -18.69% |
Consider this…
How long should a video on TikTok be?
The answer isn’t universal.
However, after analyzing almost 3 million videos, we can see that as the account grows in following, the longer the length of the video, the higher the views. Overall, the videos that receive the most views, regardless of account size, are longer videos.
How Many Videos Should I Upload Per Day? Does Posting Frequency Influence Account Growth?
One of the most talked about topics on TikTok is that consistency continues to be rewarded. I’m sure you’ve heard the saying,
“Post a video every day and you’ll see”.
But how much truth is in this advice…?
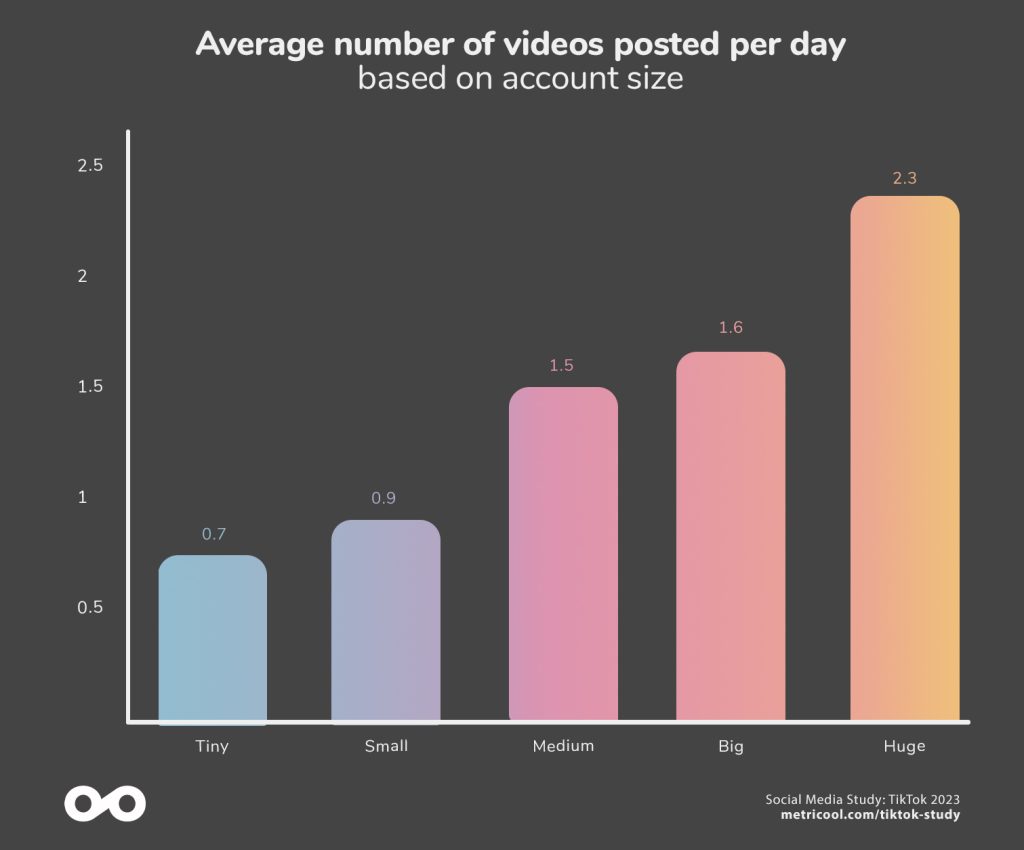
If we start by looking at the trend, we can see that the larger the account size, the higher the posting frequency.
So much so that, on average, Huge accounts maintain an average posting frequency of two videos per day, vs. an average of one video for every two days for Tiny accounts.
| 2022 | 2023 | Difference | |
| Tiny | 0.7 | 0.74 | +5.48% |
| Small | 0.9 | 0.91 | +0.86% |
| Medium | 1.3 | 1.5 | +14.57% |
| Big | 1.6 | 1.64 | +2.35% |
| Huge | 2 | 2.3 | +17.44% |
Without a doubt, a high posting frequency is the trend on TikTok.
Does the posting frequency influence video reach and interactions?
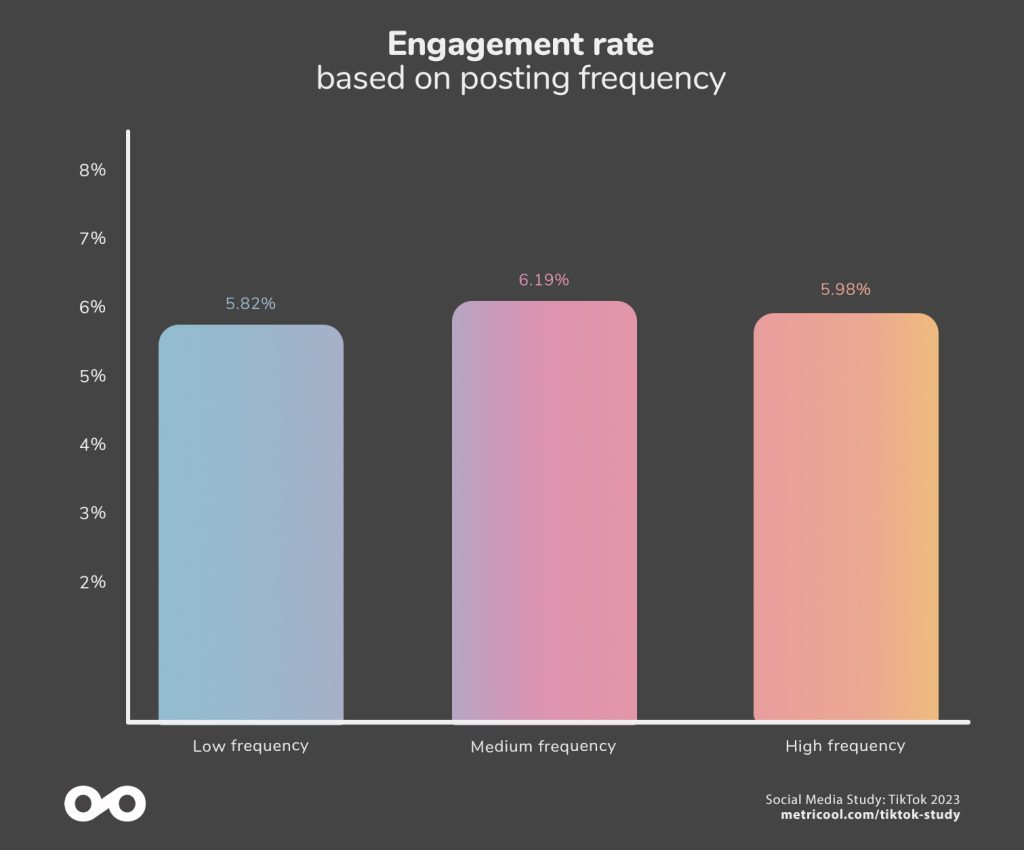
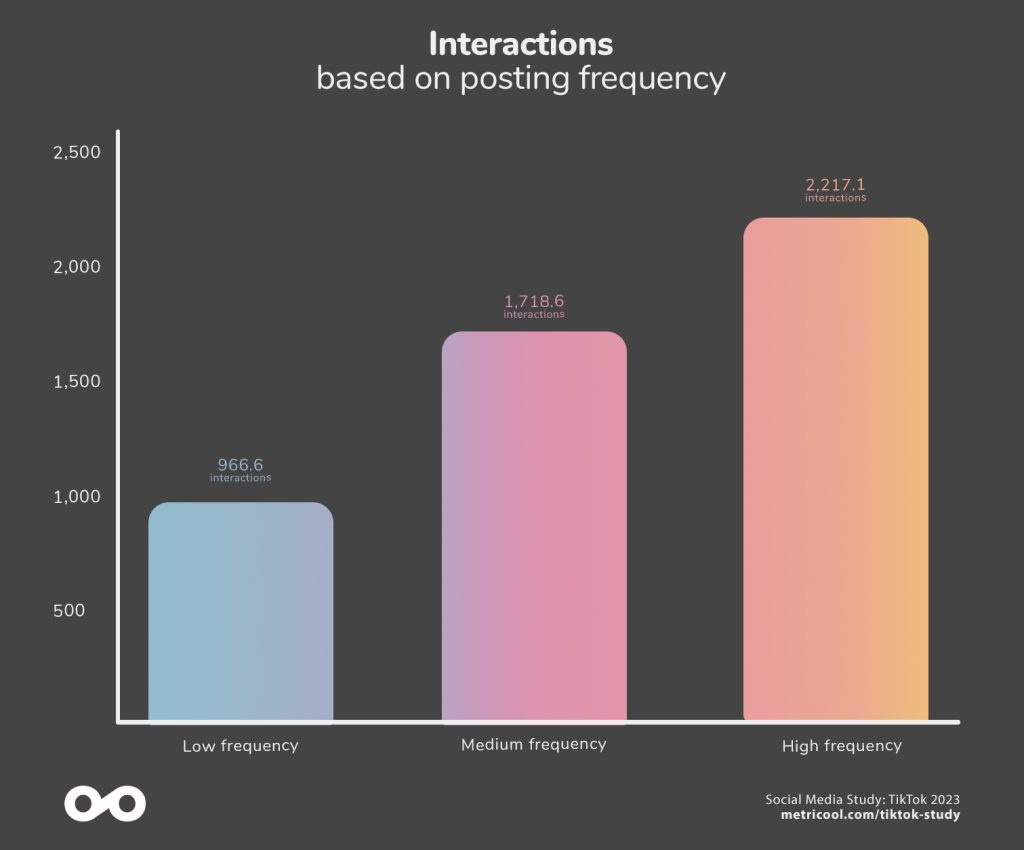
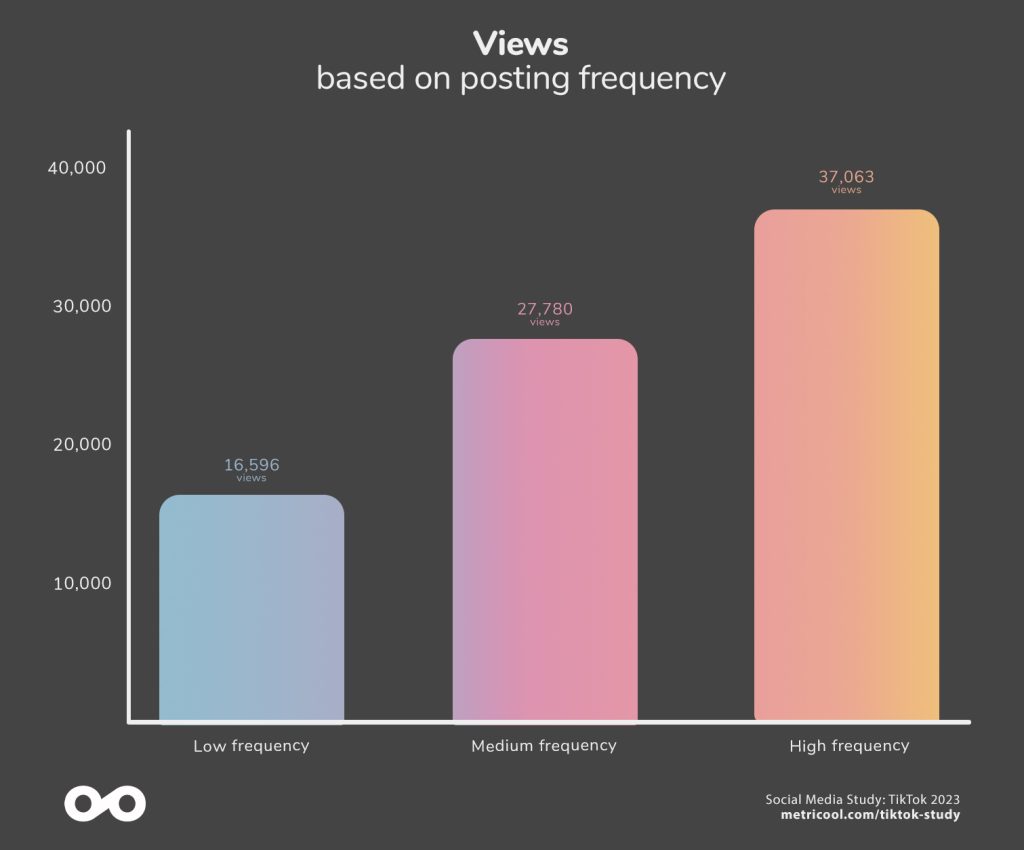
Considering a standard posting frequency of three videos per week, we can see that the higher the posting frequency, the higher the interactions or video views, although the overall engagement rate doesn’t change significantly.
Having this data, we can see that the highest posting frequencies belong to the largest accounts, but the difference between a regular and high frequency isn’t substantial.
| 2022 | 2023 | Difference | |
| Low frequency | 6.40% | 5.82% | -8.99% |
| Medium frequency | 6.80% | 6.19% | -9.02% |
| High frequency | 7.10% | 5.98% | -15.75% |
| 2022 | 2023 | Difference | |
| Low frequency | 1,093 | 966.6 | -11.56% |
| Medium frequency | 1,966 | 1,718.6 | -12.58% |
| High frequency | 2,357 | 2,217.1 | -5.94% |
| 2022 | 2023 | Difference | |
| Low frequency | 17,155 | 16,596 | -3.26% |
| Medium frequency | 29,849 | 27,780 | -6.93% |
| High frequency | 33,012 | 37,063 | +12.27% |
Consider this…
How long should I maintain the standard posting frequency (3 videos per week) to see results?
There is no direct causal relationship between the time you post a daily video and an increase in interactions or views. In the end, quality content is more important on TikTok than the number of followers an account has, meaning any video is likely to see great results.
In this study what we observed is that the difference in metrics by posting frequency starts to make a larger impact after 2 weeks of maintaining a high posting frequency [3 or more videos per week].
What is The Best Time to Post on TikTok?
Is there a best time and day to publish a TikTok video? Yes, thanks to the data.

As we can see in the graph, the best time to post on TikTok is 8 p.m. every day of the week, except Saturdays which is at 6 p.m.
Consider this…
Personalized TikTok hours
The time and day extracted from the study is an average from the combined data analysis of all accounts. However, you can also find the best times and days for your account based on the times your audience is online.
What is the best day to post on TikTok?
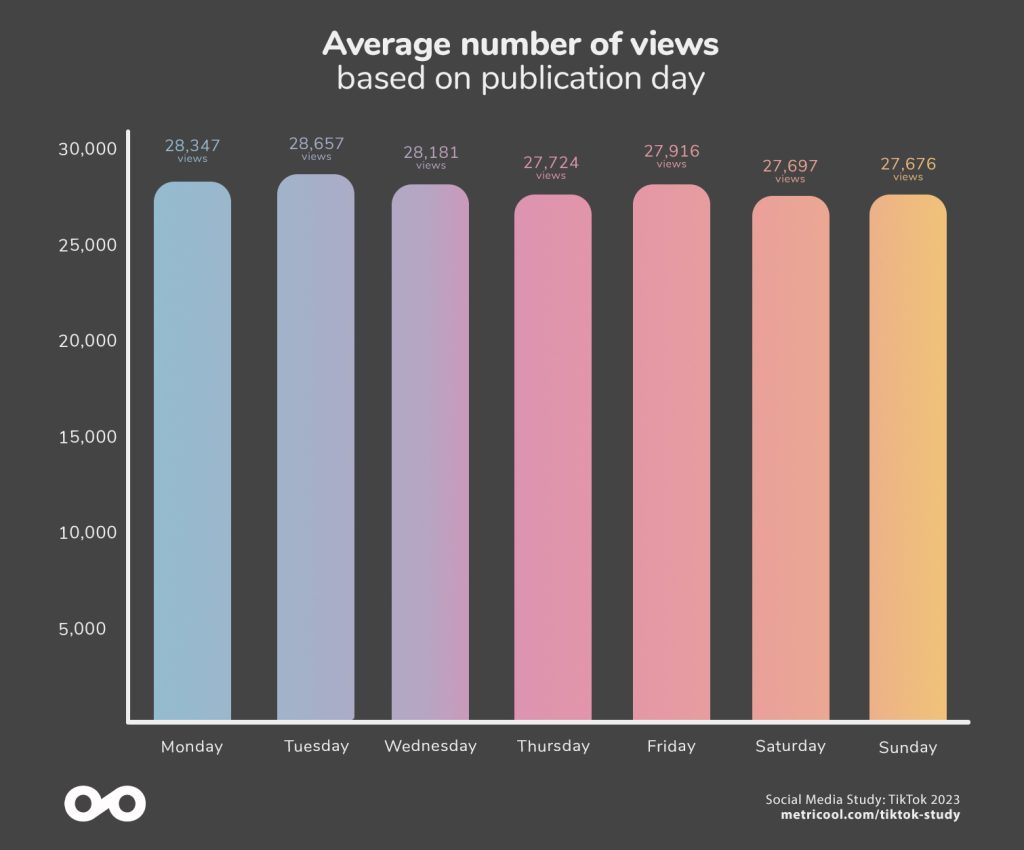
After analyzing over 3M videos, the day with the highest average number of views is Tuesday.
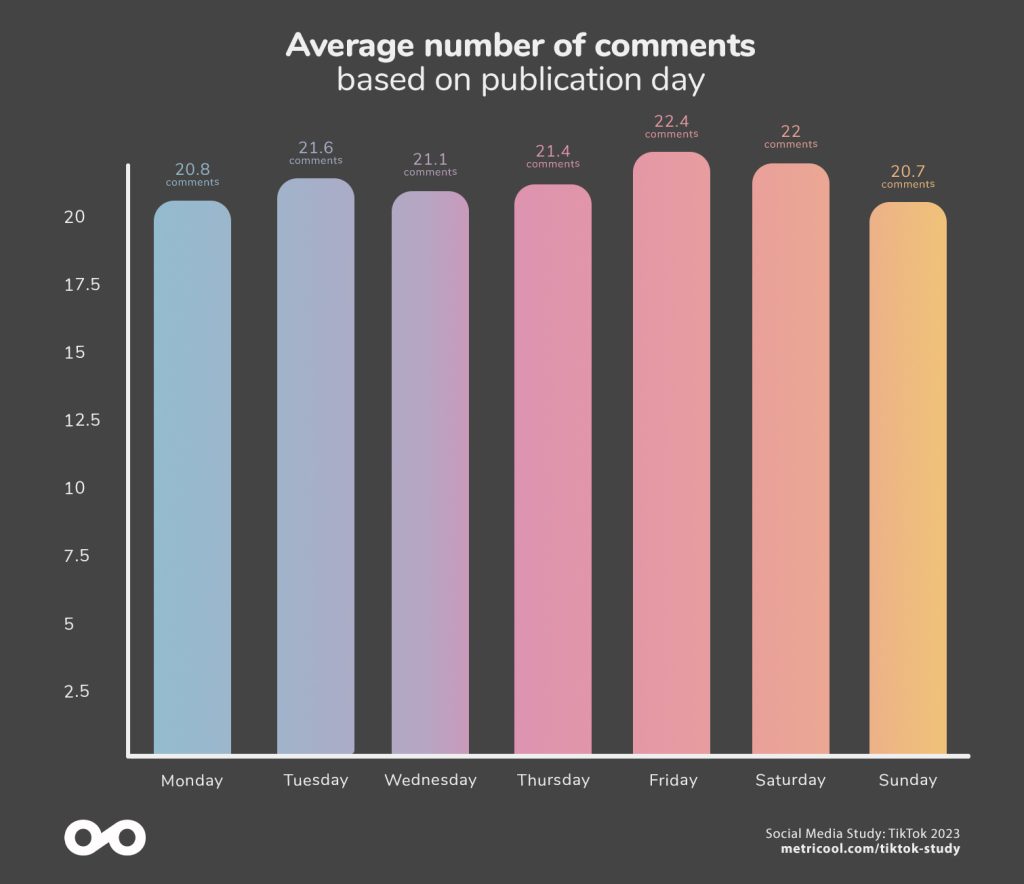
And the day that videos receive the most comments is on Fridays followed closely by Saturdays.
Again, the graphs have the answers.
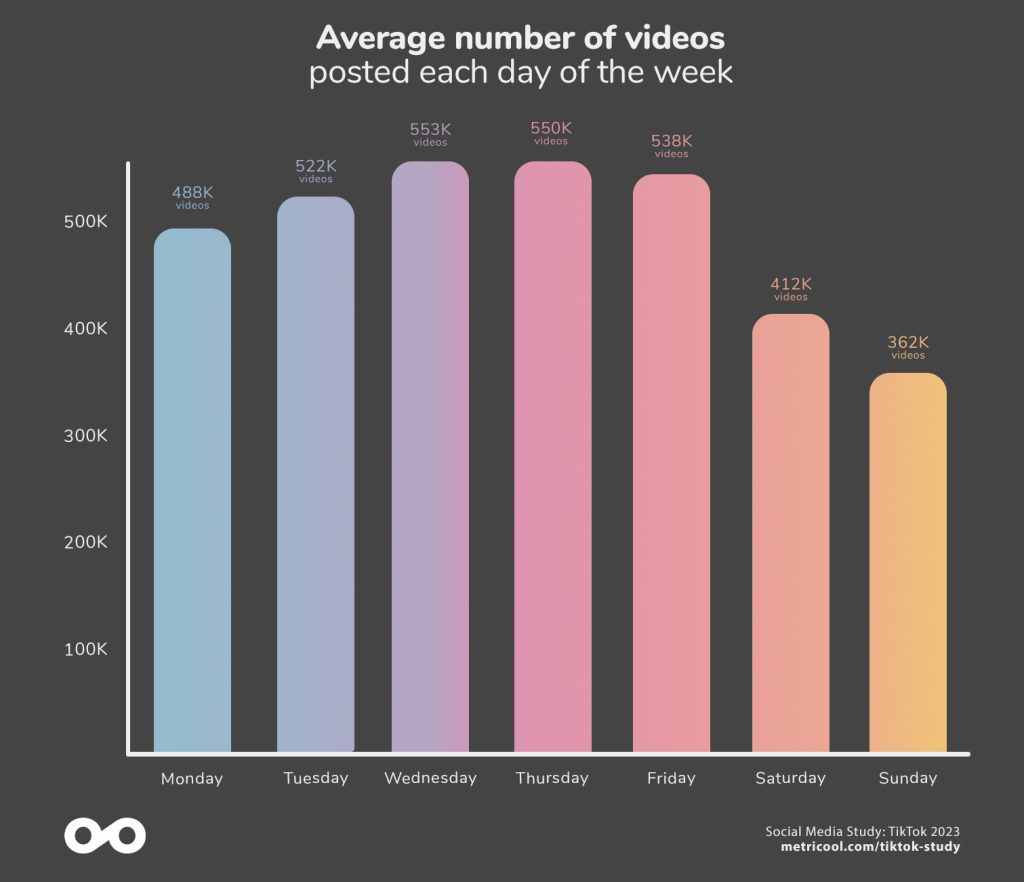
Sunday is the day when the least videos are posted, and Wednesday is the day when most videos are posted.
Consider this…
Regardless of whether it’s a personal or business account, all of the videos analyzed correspond to a sample of users with a generally professional orientation, which may explain the drop in weekend posting.
Hashtags, Mentions, Sounds, Emojis… Can They Help Boost Reach for My Videos?
In TikTok, you can view the traffic sources of your videos to know where your video impressions are coming from. On the app, you can see these sources from the For you page, your personal profile, or through the following tab.
In Metricool, you can also see the following information: analyzing if impressions come from a search, a sound, or a hashtag. Thanks to this feature, we have been able to analyze all traffic resources to draw conclusions about business accounts. Personal accounts don’t have access to this data.
Which traffic sources bring in the most views on TikTok?
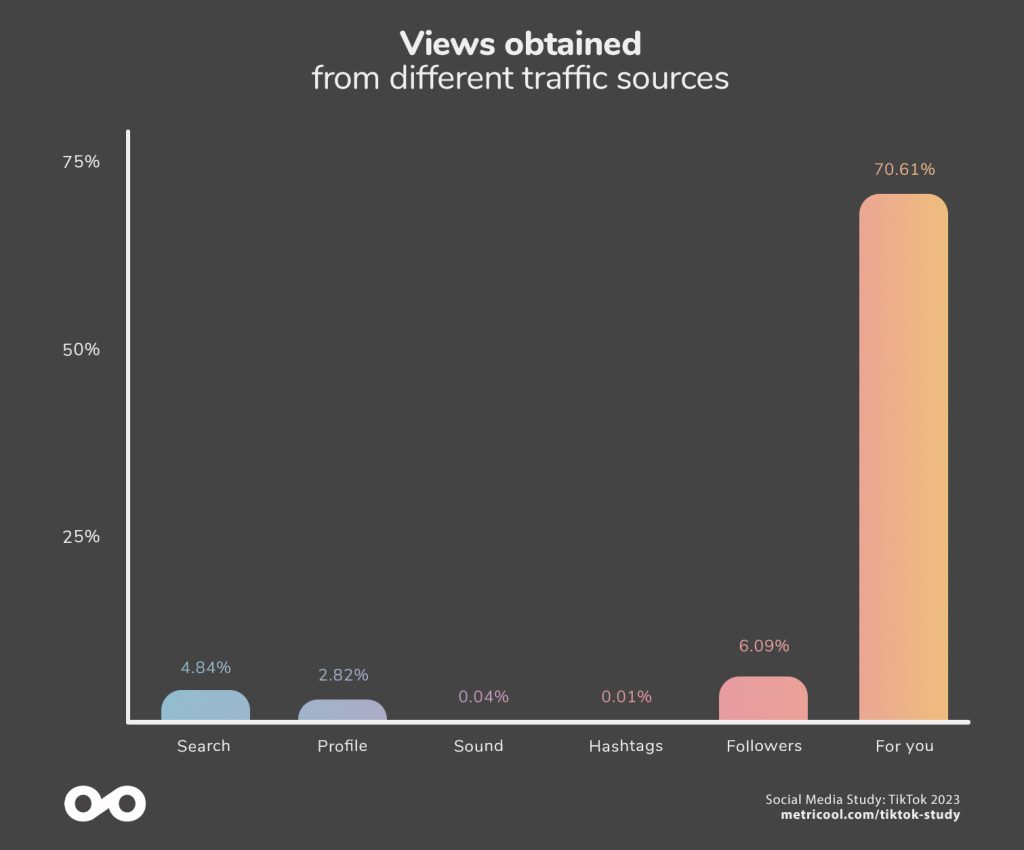
If we look at what percentage each source contributes to overall video views, we can see that the main source that brings in the most views to your videos is the “For you” section of TikTok. On average, this continues close to 70%, followed far behind by the “Follow” section with 6.09%
In this new study, we can see that the search traffic source has grown twice as much with 4.48%, surpassing the personal profile with 2.82%.
| 2022 | 2023 | Difference | |
| Search | 2.81% | 4.84% | +72.09% |
| Profile | 3.66% | 2.82% | -23.01% |
| Sound | 0.05% | 0.04% | -17.83% |
| Hashtags | 0.01% | 0.01% | +18.29% |
| Followers | 8.49% | 6.09% | -28.33% |
| For You | 74.38% | 70.61% | -5.07% |
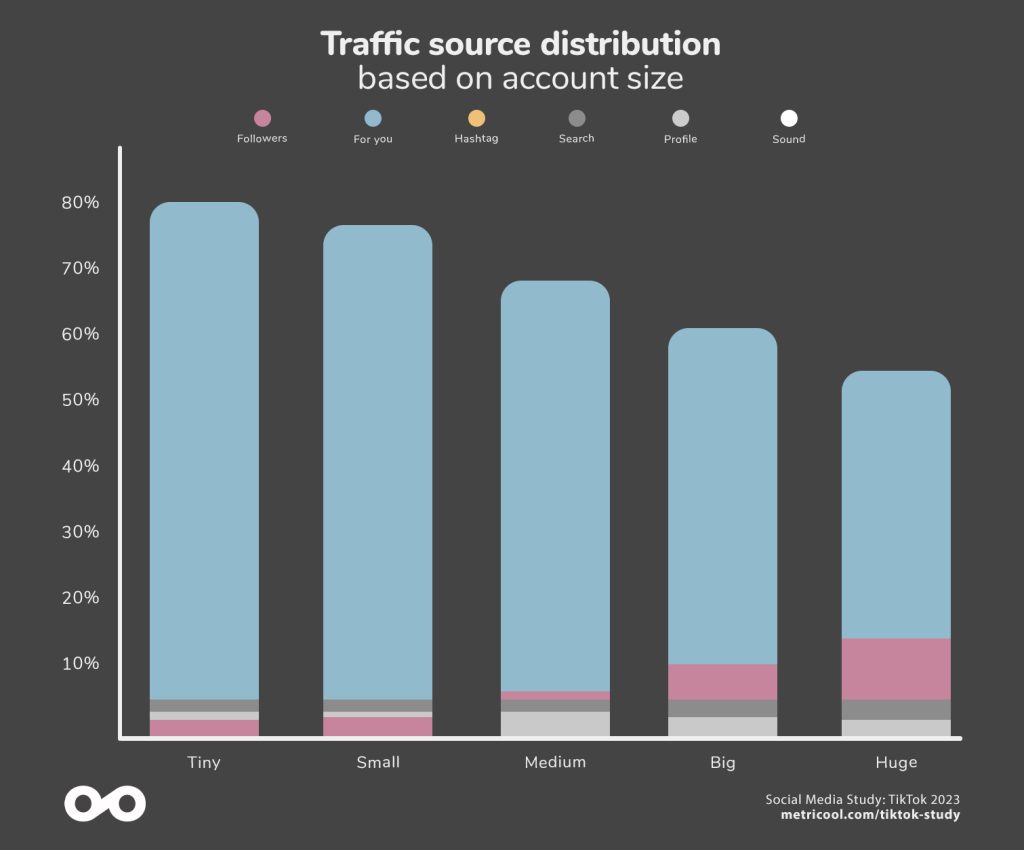
Traffic source distribution based number of followers: Tiny accounts
| 2022 | 2023 | Difference | |
| Search | 2.33% | 4.60% | +97.42% |
| Profile | 3.97% | 3.62%% | -8.82% |
| Sound | 0.04% | 0.03% | -25% |
| Hashtags | 0.02% | 0.02% | 0% |
| Followers | 2.62% | 2.05% | -21.76% |
| For You | 84.38% | 81.23% | -3.73% |
Traffic source distribution based number of followers: Small accounts
| 2022 | 2023 | Difference | |
| Search | 2.55% | 4.63% | +81.57% |
| Profile | 3.42% | 2.98% | -12.87% |
| Sound | 0.05% | 0.05% | 0% |
| Hashtags | 0.01% | 0.01% | 0% |
| Followers | 4.93% | 2.68% | -41.99% |
| For You | 80.57% | 76.78% | -4.70% |
Traffic source distribution based number of followers: Medium accounts
| 2022 | 2023 | Difference | |
| Search | 3.37% | 4.85% | +43.92% |
| Profile | 3.71% | 2.84% | -23.45% |
| Sound | 0.07% | 0.05% | -28.57% |
| Hashtags | 0.01% | 0.01% | 0% |
| Followers | 8.52% | 5.81% | -31.81% |
| For You | 72.64% | 69.10% | -4.87% |
Traffic source distribution based number of followers: Big accounts
| 2022 | 2023 | Difference | |
| Search | 3.06% | 5.17% | +68.95% |
| Profile | 3.53% | 2.22% | -37.11% |
| Sound | 0.06% | 0.05% | -16.67% |
| Hashtags | 0.01% | 0.01% | 0% |
| Followers | 13.97% | 10.04% | -28.13% |
| For You | 65.16% | 61.70% | -5.31% |
Traffic source distribution based number of followers: Huge accounts
| 2022 | 2023 | Difference | |
| Search | 2.90% | 5.17% | +78.28% |
| Profile | 3.53% | 1.87% | -47.03% |
| Sound | 0.02% | 0.03% | +50% |
| Hashtags | 0.01% | 0% | -100% |
| Followers | 22.55% | 14.25% | -33.87% |
| For You | 55.23% | 55.55% | +0.58% |
If we look at the contribution of each traffic source according to the size of the account, we can see that the larger the account size, the greater the relevance of the Follow section. However, overall the For You section doesn’t fall below 55%.
If we classify the data according to video views, we can clearly see that the videos with the most views, to a greater extent, come from the For You section.

Traffic source distribution based number of views: Tiny
| 2022 | 2023 | Difference | |
| Search | 2.81% | 3.90% | +38.79% |
| Profile | 4.32% | 3.64% | -15.74% |
| Sound | 0.06% | 0.04% | -33.33% |
| Hashtags | 0.01% | 0.02% | +100% |
| Followers | 7.33% | 4.66% | -36.43% |
| For You | 75.91% | 74.67% | -1.63% |
Traffic source distribution based number of views: Small
| 2022 | 2023 | Difference | |
| Search | 3.26% | 6.30% | +93.25% |
| Profile | 2.71% | 2.13% | -21.40% |
| Sound | 0.05% | 0.06% | +20% |
| Hashtags | 0.01% | 0.01% | 0% |
| Followers | 7.97% | 6.48% | -18.70% |
| For You | 75.65% | 67.70% | -10.51% |
Traffic source distribution based number of views: Medium
| 2022 | 2023 | Difference | |
| Search | 3.06% | 7.32% | +139.22% |
| Profile | 2.78% | 2.08% | -25.18% |
| Sound | 0.05% | 0.05% | 0% |
| Hashtags | 0.01% | 0.01% | 0% |
| Followers | 12.46% | 9.49% | -23.84% |
| For You | 67.08% | 57.52% | -14.25% |
Traffic source distribution based number of views: Big
| 2022 | 2023 | Difference | |
| Search | 2.58% | 5.43% | +110.47% |
| Profile | 2.96% | 1.51% | -48.99% |
| Sound | 0.04% | 0.04% | 0% |
| Hashtags | 0% | 0% | 0% |
| Followers | 13.37% | 9.36% | -29.99% |
| For You | 65.98% | 63.71% | -3.44% |
Traffic source distribution based number of views: Huge
| 2022 | 2023 | Difference | |
| Search | 1.60% | 3.50% | +118.75% |
| Profile | 1.46% | 0.84% | -2.42% |
| Sound | 0.02% | 0.02% | 0% |
| Hashtags | 0.01% | 0% | -100% |
| Followers | 6.37% | 4.80% | -24.65% |
| For You | 83.35% | 81.33% | -2.42% |
As for the posting frequency, there is no difference compared to the previous trend.
What about the Hashtag and Sound section on TikTok?
Well, its contribution is minimal, almost null according to the sample analyzed.
In regards to hashtags, we have looked for any possible relationship between the number of hashtags included in the caption and the higher traffic source, however, there is no correlation.
The same goes for the trending sounds section, almost nil, regardless of account size or if the video is viral or not. Keep in mind though, the sound in the video is probably relevant in terms of TikTok’s own algorithm.

Noting a curious find, the average number of hashtags per video is 6.7, 1.96 emojis per video, 0.17 mentions per video, and 25 words in the caption.
Consider this…
Are hashtags and sounds in TikTok useless then?
The answer is no.
This traffic source represents those users that find your video after clicking on a specific hashtag, and then finding your video, and likewise with sounds. However, both factors can still help your video rank higher in the eyes of the algorithm.
Everything points to the fact that TikTok’s algorithm is selective enough to decide what kind of content interests each user, regardless of how the account posting the video wants to rank.
By using trending sounds and hashtags, you are more likely to compete with a higher volume of content. The exposure of your videos (mainly in the For You section) will depend on many other factors that can compete during that trend.
Uncovering the Answers to TikTok’s Biggest Questions. Summary of The Study
What’s more important on TikTok, likes or views?
The short answer is neither.
Let’s go with the long answer. Both likes and views are correlated. The more exposure (views) your video gets, the more likes it will receive. The key is in the quality of the content and therefore, if it signals that it’s being well-received by the audience, it will generate more views. Among these interactions, of course, are likes, as well as any other type of positive interaction such as comments, favorite, follow, and audience retention.
What content is most viral on TikTok?
Videos that get more views are longer and receive more signals that they are being liked, which also keeps engagement high.
The key is to be able to retain the audience for a longer period of time and to have them express a liking towards the content, whether that be watching the entirety of the video or leaving a positive interaction.
How many videos should I post per day on TikTok to get more interactions and views?
The increase in interactions or views grows after two weeks of maintaining a high posting frequency [1 video or more per day].
That is, you need to maintain a high posting frequency, but you don’t have to wait months to see results. On average, after 2 weeks you will notice an improvement in views and interactions.
Keep in mind that you need to be posting quality content, and videos that are relevant to your audience and brand.
Are you a scientific soul?
If you want access to all of the data and graphics from the study, you can find it in this Looker Studio dashboard.
What is the best posting frequency on TikTok?
It’s clear that the tendency is to post one video a day and to maintain that posting frequency for as long as possible.
However, you can also see that posting 3 videos a week is an optimal frequency, which can give you more room to spend efforts on increasing the quality of your videos, something that has proven extremely important on the network.
The best time to post on TikTok in 2023 is…
Friday at 8 p.m. This is the data we found from the study.
⬇️ Share the 2023 TikTok Study ⬇️

