

Like most websites, we use own and third party cookies for analytical purposes and to show you personalised advertising or based on your browsing habits.
Generally, the information does not directly identify you, but can provide you with a more personalised web experience. Because we respect your right to privacy, you may choose not to allow us to use certain cookies. However, blocking some types of cookies may affect your experience on the site and the services we can offer.
For more information, you can read our cookie policy.
Custom Instagram Analytics Reports with Metricool
Inside the Instagram app, you have access to informative metrics about your content’s performance. However, you can’t view this data in one comprehensive document. With Metricool, you can create and automate custom Instagram analytics reports for each day, week, or month.
Having this data at hand is invaluable to your Instagram marketing strategy, and will allow you to benchmark your content, compare it against your competitors, and continue to improve your tactics.
Where to Find Instagram Analytics
Where can you find this information? There are two ways, inside the Instagram app or by using a third-party Instagram analytics tool like Metricool.
Instagram App Analytics
To find this data in the Instagram app, you first must have an Instagram Business or Creator account. Then, you will navigate to your profile page and head into the Professional dashboard. Here you can view your content analytics including insights into your content performance, creator tools, tips, and resources. The insights within the app include the following sections, which you can click into to view the breakdown of specific content: Accounts reached, accounts engaged, total followers, and content you shared.
Instagram Analytics with Metricool
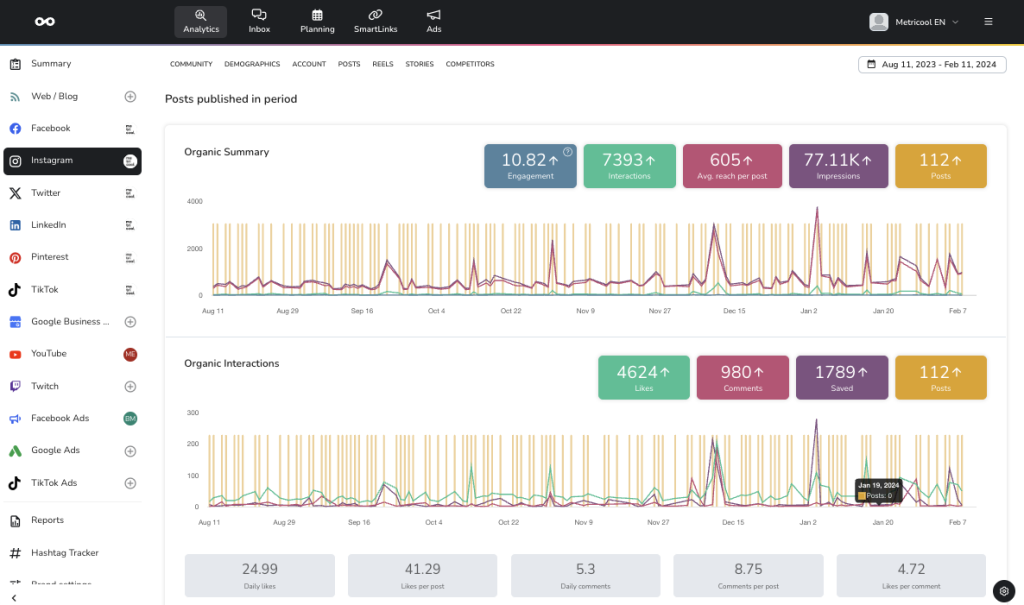
With Metricool, you can also connect your Instagram Business or Creator account to view the following analytics, as well as metrics for feed posts, Stories, and Reels, such as impressions, interactions, reach, engagement, profile views, and competitor data. View up to three months of historical data with a free account, or unlimited with a Premium account.
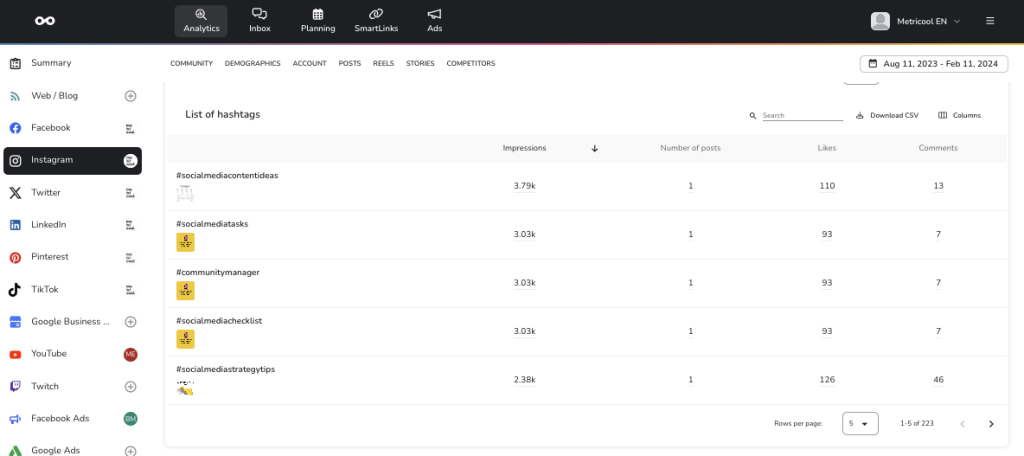
Plus, if you run any ads across Facebook and Instagram, you can also view your campaign metrics and a list of your top-performing ads. You can also see a list of the hashtags that have generated to most impressions, likes, and comments.
How to Create an Instagram Social Media Report
Extracting the data each month, gathering it in Excel, putting it in order, and presenting it to the client is a process that can take hours. To save you both time and a headache, Metricool will generate this data for you. Then, you can organize this data into a clean, branded document.
So at the end of the month, you will already have all of the relevant information ready to present to your client or manager, available to download in a PDF or PPT:
- Log in to Metricool with your credentials.
- Click on ‘Evolution’, the first tab in the top menu.
- Scroll down to the ‘Reports’ section on the left column.
- Choose or create a template: When creating your report for the first time, you can create a new template and choose the period you want to analyze, the language, the brand logo, the social platforms you want to include, and how you want the analytics to appear.
- Choose to download the report in either PDF or PPT and press Download.
It’s as easy as that!
💡 Metri Tip
Skip all these steps next time! Add an email at the bottom of the reports page where it says “Automatic monthly report” and select which day of the month you want this to be sent to that person.
Even include a custom message to further personalize your report.
What Does An Instagram Analytics Report Contain?
We touched on some of the metrics included in this document, but what does it include? Below we will break down what is included inside Metricool’s Instagram analytics reports with a social media analytics report sample.
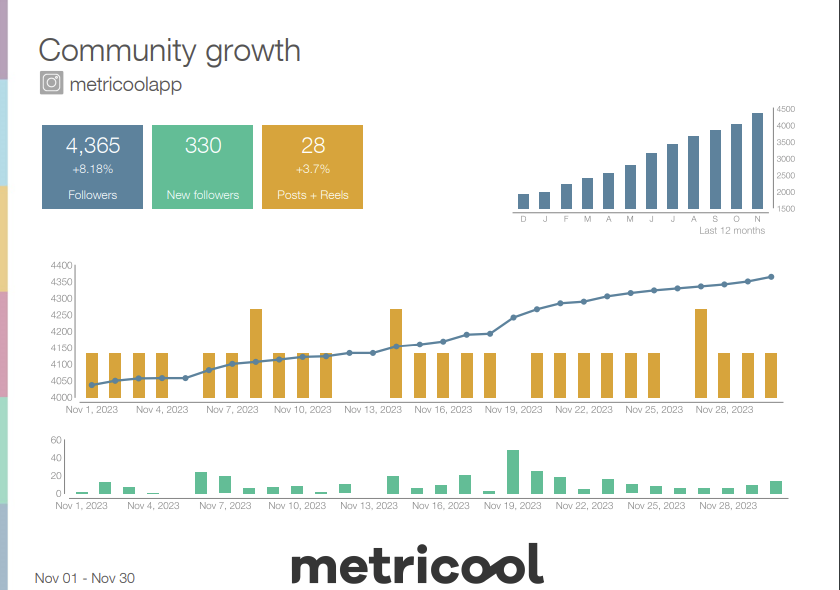
⚡️ Community Growth
The pillar on which your Instagram growth is based is the number of followers that make up your community. In this section, you will find:
- The number of followers you have gained
- The percentage of growth in the period
- How many posts and Reels you have published in the period
- A graph of your followers over the last 12 months
You can also see your audience’s demographics by gender, age, country, and city, key aspects of knowing your audience.
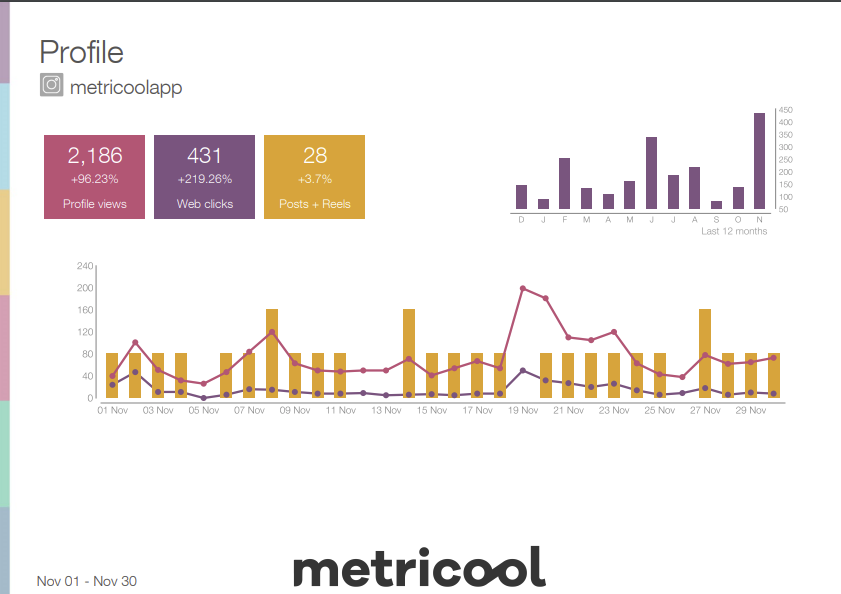
⚡️ Profile
Next, you will find crucial information about your profile including the total profile views, web clicks, impressions, average reach per day, and profile views.
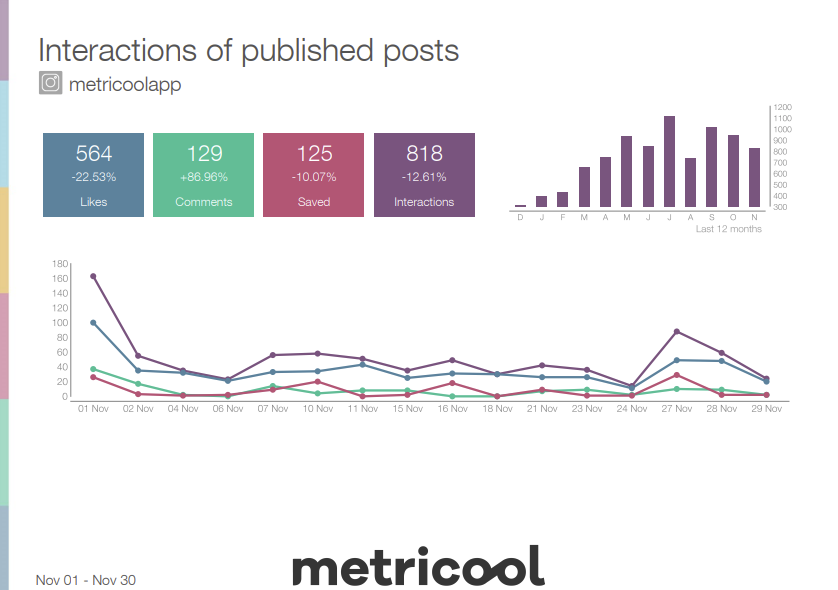
⚡️ Interactions
Interactions are the best way to measure your audience’s engagement with your content.
In the Metricool reports, you have several slides that show you this performance:
✅ Average reach per day of your account. Also, your profile’s impressions, visits, and the number of posts published.
✅ Posts: the total number of posts you have published and the engagement achieved.
✅ Post Interactions: Actions that the user has taken directly from your post: likes, comments, saves, and total interactions.
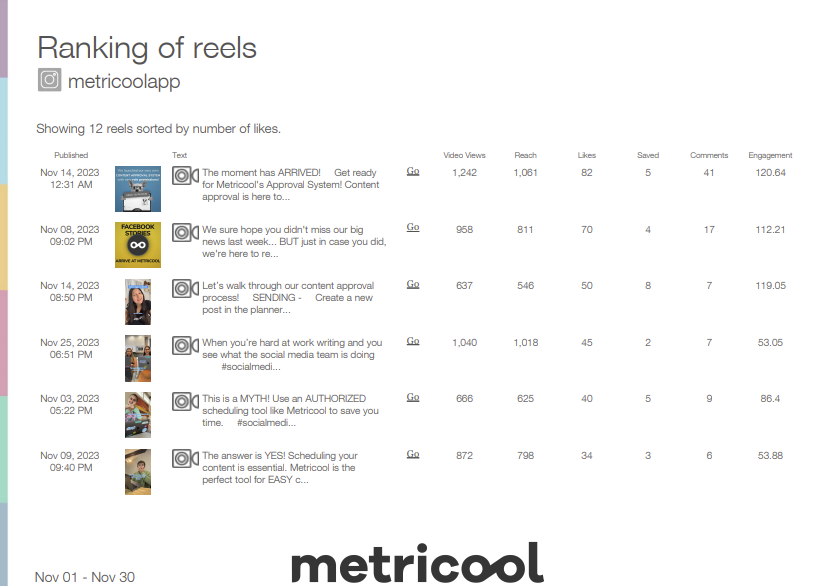
⚡️ Reels
Reels are Instagram’s short videos recorded in vertical format. Since the social network incorporated them into its content they have not stopped growing. What better way to know how they are performing than with Metricool’s reports?
In Metricool reports you are going to be able to see:
✅ Engagement along with the number of Reels.
✅ The interactions with likes, comments, and saves.
✅ Ranking of your top-performing Reels with data on the total video views, reach, likes, saves, comments, and engagement rate.
⚡️ Post and hashtag rankings
Rankings are the best way to see which posts have outperformed the rest. Metricool ranks the top 20 posts by default. In this list, you can see the number of impressions, likes, saves, comments, reach, and engagement of each post.
The ranking is based on likes by default, though you can choose the metric you want the list to be sorted by.
If you have promoted posts in the period, you will see an additional slide with a doughnut chart for paid and organic impressions. Also, a list of the boosted posts and their performance. Bear in mind that this info only displays if you have your Facebook Ads account connected to Metricool.
With the hashtags ranking, you can see all the hashtags you have used and their average performance based on the posts that included them.
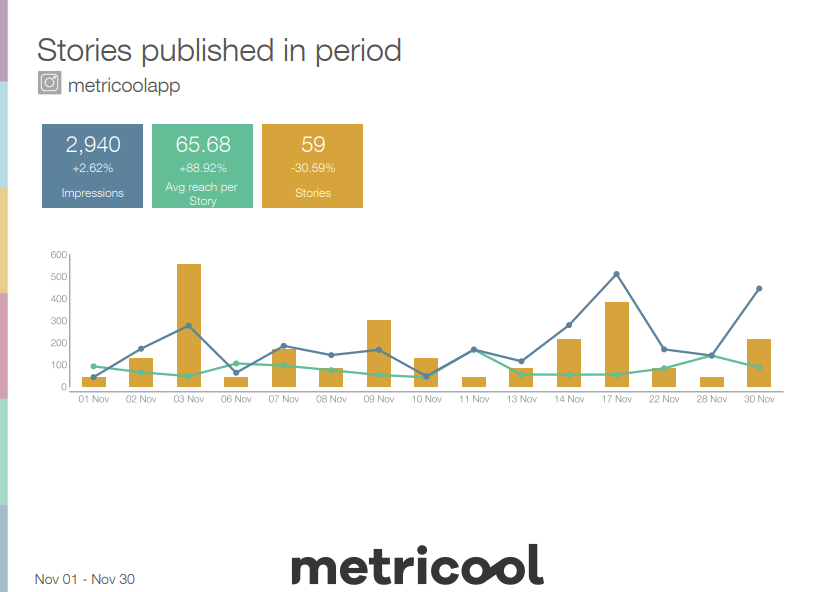
⚡️ Stories
There is a specific section for this type of format:
✅ In the first section, you have an overview of the stories on your profile: the number of stories you have uploaded, the impressions you have achieved, and the average reach per story.
✅ In the second section, you have a ranking of stories, similar to that of the posts. This shows impressions, reach, replies, tap forward, tab back, and exits.
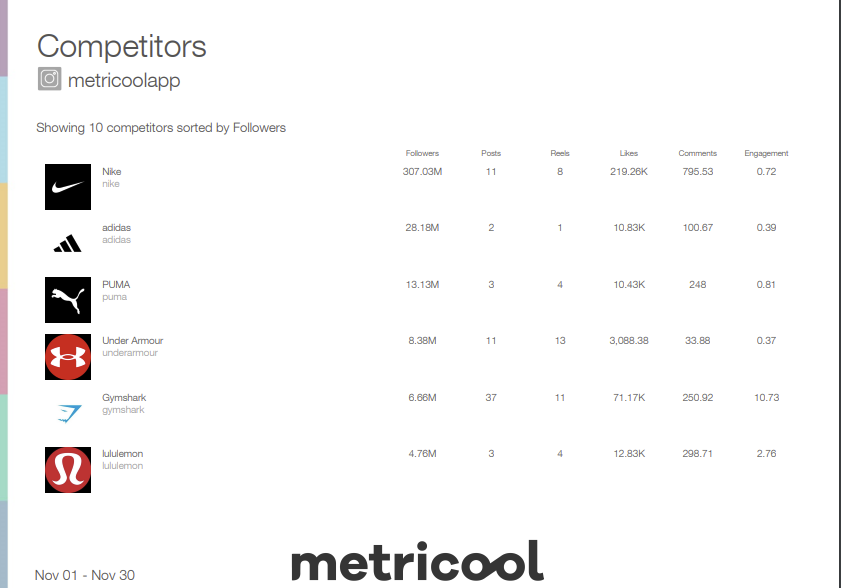
⚡️ Competitors
Without competition, there is no evolution, right? On Instagram, it is also essential to see the path of your competitors to define your strategy, modify it if necessary, or celebrate your growth.
On Metricool, you can add competitors to your report and track their performance including the number of followers, posts, likes, comments, and engagement. This table can be sorted by the metric you consider most relevant:
Voilà! All those hours you thought you would be in front of Excel are gone. With one click, you can have your custom Instagram analytics report at your fingertips. Now, you can move on to other work because you already have the performance report to deliver to your client.
If you miss something, you can always ask us in the comments or look at the Metricool Mega Tutorial with all the features. And for those of you who haven’t created a Metricool account yet, you can create an account for free (for life!) or upgrade to a Premium account and access all of our reporting features.