

Like most websites, we use own and third party cookies for analytical purposes and to show you personalised advertising or based on your browsing habits.
Generally, the information does not directly identify you, but can provide you with a more personalised web experience. Because we respect your right to privacy, you may choose not to allow us to use certain cookies. However, blocking some types of cookies may affect your experience on the site and the services we can offer.
For more information, you can read our cookie policy.
How to Use TikTok Analytics to Measure Your Strategy
Developing a TikTok strategy isn’t complete without analytics. Analyzing your TikTok profile’s performance is crucial to understanding how to improve your content and compete with others in your industry.
In this article, we dive into what metrics you should analyze to grow your TikTok account strategically. While you can view this content inside the app, you can also use a TikTok analytics tool like Metricool to view all essential metrics in one place.
Importance of TikTok Analytics for Your Business
You may wonder how TikTok analytics translate into business success. With the ease of TikTok Shopping, affiliate marketing, and social media advertising, selling on TikTok leads to great business success.
This platform is huge for brand discovery and awareness, and the 7th most trusted app to deliver a positive ROI for brands. Businesses can leverage this platform to cultivate an online community while driving traffic to websites or stores through multiple content mixes.
TikTok analytics reveal the impact of your marketing strategy, providing audience retention insights, content engagement, profile visits, and conversion rates. With this data, your team can make informed decisions based on audience feedback and content success.
Strategies are at the heart of success, and analytics are the blood that pumps through to supply oxygen to the rest of the business. As you analyze your metrics and refine your strategy, use this marketing guide to perfect your TikTok efforts:
How to Check TikTok Analytics
You must have a TikTok Business or Creator account to check TikTok analytics within the application.
The main difference between a Business/Creator account and a Personal TikTok account is access to analytics, so it is important that if you want to know the performance of your content, you switch your account.
If you haven’t switched your account, don’t worry, it’s super easy!
How to convert to a TikTok Business account
To configure your Business account, head to Settings and privacy in your TikTok profile by pressing the three lines in the upper right corner.
▶️ Then, follow these steps:
Account > Switch to Business Account
Follow the prompts, and select the category of your account, brand, or business. Then boom! You will access TikTok Business Suite, a complete marketing tool to help manage and grow your business through TikTok.
How to Use Native TikTok Analytics
Now that you have your TikTok Business account, it’s time to go on to see the analytics of your profile and your videos. Click on the Business Suite option and then on Analytics. Here you will find all your content performance and audience metrics.
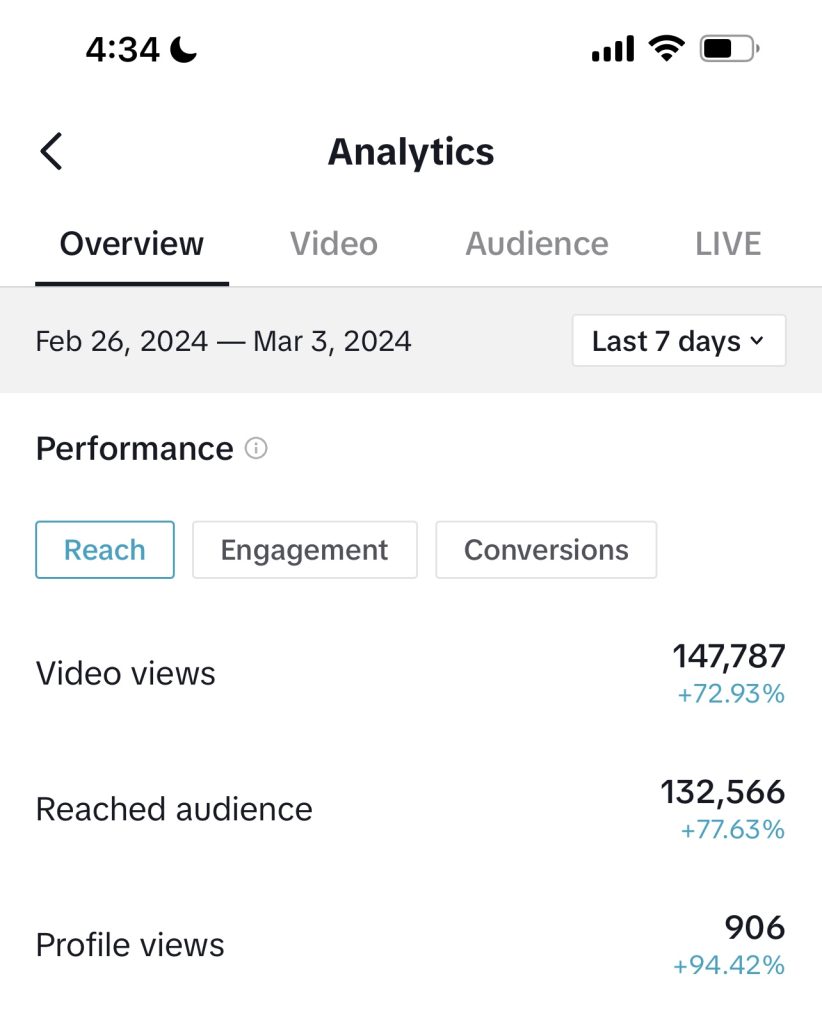
Overview Analytics
The first tab available is a summary in which you can choose whether to view the information for the last 7 days, up to 12 weeks. In this tab you will see four different analytics sections:
- Performance: See your overall content performance metrics: reach, engagement, and conversions.
- Product links: If you have promoted a physical product via a link, here you will find your product link clicks, product link complete payments, and product link GMV.
- Your most popular videos: View which posts have performed the best in the analyzed period with their total view count at the bottom.
- Followers: Measure your follower growth broken into three metrics: net growth, new followers, and lost followers. If you click “See more” you can view your audience’s activity and demographics.
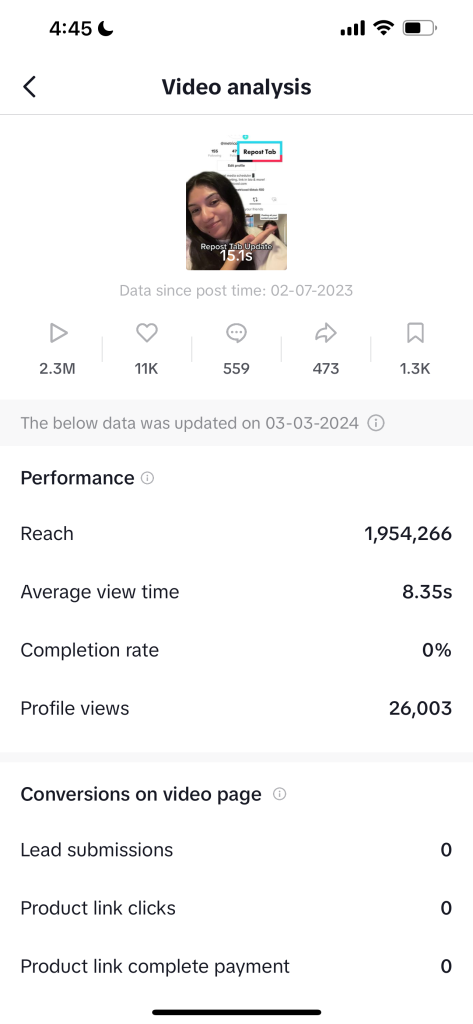
Video Analytics
In the second tab of the top menu, you will have a list of all your published videos. By default this will organize your videos by “Most recent” but you can change this to order by “Most number of video views”.
In this list, you will see the total video views, number of likes, and comments for each video. When clicking on each video, you have metrics for its performance, conversions, audience retention, traffic source, and viewer insights.
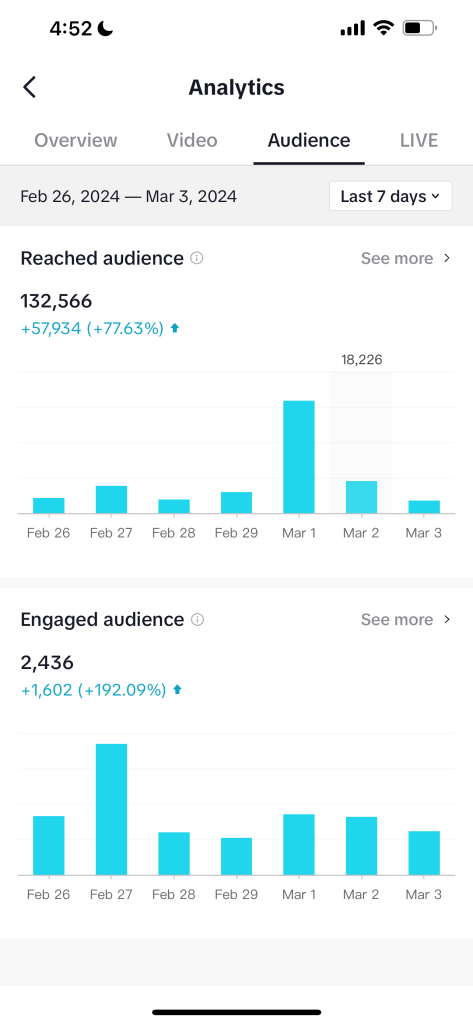
Audience Analytics
In this section, you will find all of your audience’s metrics, broken into Reached audience and Engaged audience. What’s the difference between these two? Reached audience refers to those who have watched your content at least once, whereas the engaged audience is those who have engaged with at least one of your posts (liked, commented, or shared).
These aggregate numbers of reached vs. engaged audience will show how many total users have visited or engaged with your content and at what percentage this has grown over the period.
By pressing on “See more” for either of these sections, you can view when your audience is active, your audience’s age and gender distribution, and the top 10 countries and cities your audience comes from.
LIVE Analytics
If you have uploaded any LIVE videos to the platform, you can view your LIVE analytics here.
These metrics include your total LIVE views, total LIVE time, new viewer count, new followers, unique viewers, and the amount of diamonds received.
Metricool: A Free TikTok Analytics Tool
If you have a personal or professional TikTok account and a Metricool account, you’re in luck.
You can analyze in detail how your videos are working and group them according to the data that interests you the most: views, interactions, and shares.
Data that helps you improve the strategy you have implemented.
What data does Metricool offer?
✅ Community
In this section, you can see your TikTok account’s growth evolution and balance of followers, broken down by day. You can also see the exact number of new followers you have gained in the period.
✅ Demographics
What is the demographic profile of your audience? In this section, you can your audience’s gender distribution and in which countries your followers are coming from, either in chart or table view.
✅ Account
Analyze how many profile visits you have had in the period, and how many posts you have published. You will also see an overview of your posts including total post views, likes, comments, and shares.
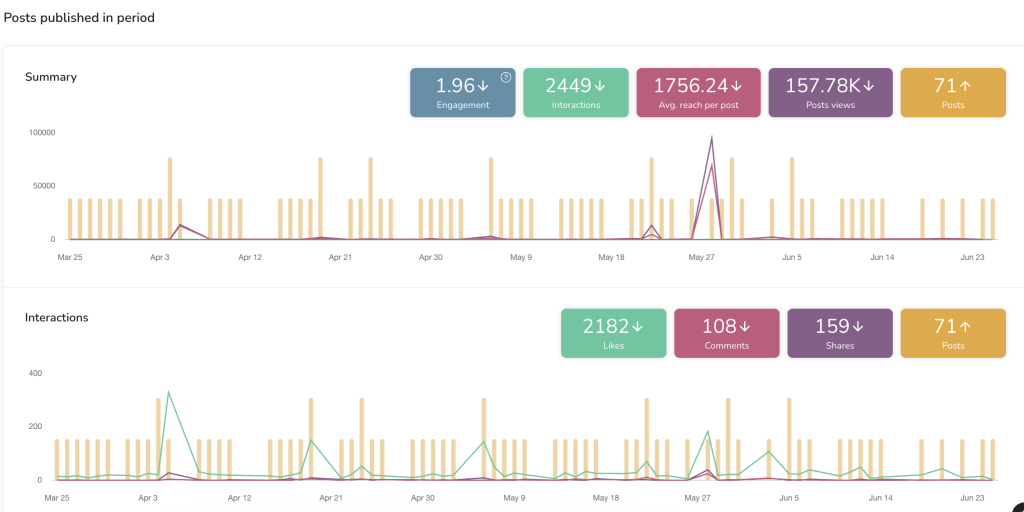
✅ Content Summary
Here you can view a summary of how your content has performed in terms of engagement, interactions, average reach per post, and post views. You can see on which days your metrics peaked by dragging your cursor over the graph.
✅ Interactions
Below, you can see a deeper breakdown of your interactions in terms of likes, comments, shares, and likes. Once again, view metrics per day by wavering your cursor over the graph.
✅ Impression Sources
Another important metric is where the source of your traffic is coming from. With impression sources, you can see where users are finding your videos.
These are divided by the TikTok section viewers found your videos, including the following sections:
- For You – View originated from a user’s For You feed
- Follow – View originated from a user’s Follow feed
- Hashtag – View originated from a specific hashtag
- Sound – View originated from the video sound
- Personal Profile – View originated from the business account profile page
- Search – View originated from a search on the Discover page
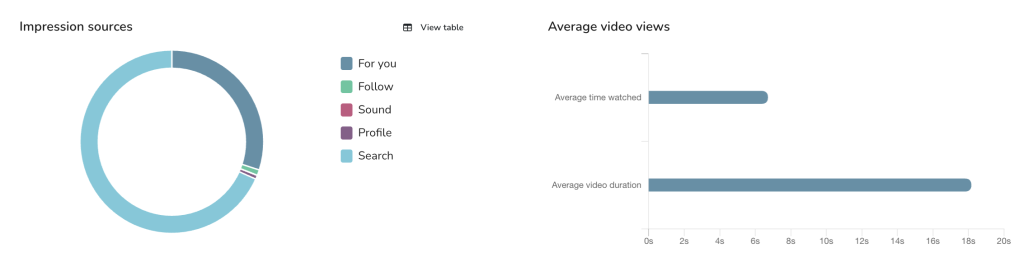
✅ Average video views
Next to impression sources, see your average time watched and average video duration in seconds.
✅ List of Videos
See which videos have performed best in the list of videos. This table is organized by the date posted by default, however, the list can be sorted by views, likes, comments, shares, reach, duration, and engagement.
So, are you ready to analyze your TikTok videos and create your winning marketing strategy? Using Metricool to schedule, manage, and analyze your content is a game-changer when it comes to smart social media marketing. With this tool, you can keep all of your social media accounts under control in one centralized place.